- The US Dollar is gaining strength as it reached the 97.30 resistance.
- The level to beat for bulls is the 97.55 resistance.
- Key support is located at the 97.00 figure.
The stellar Nonfarm Payrolls was the catalysts behind the bull move this Friday. The US added 224K jobs vs. 160K.
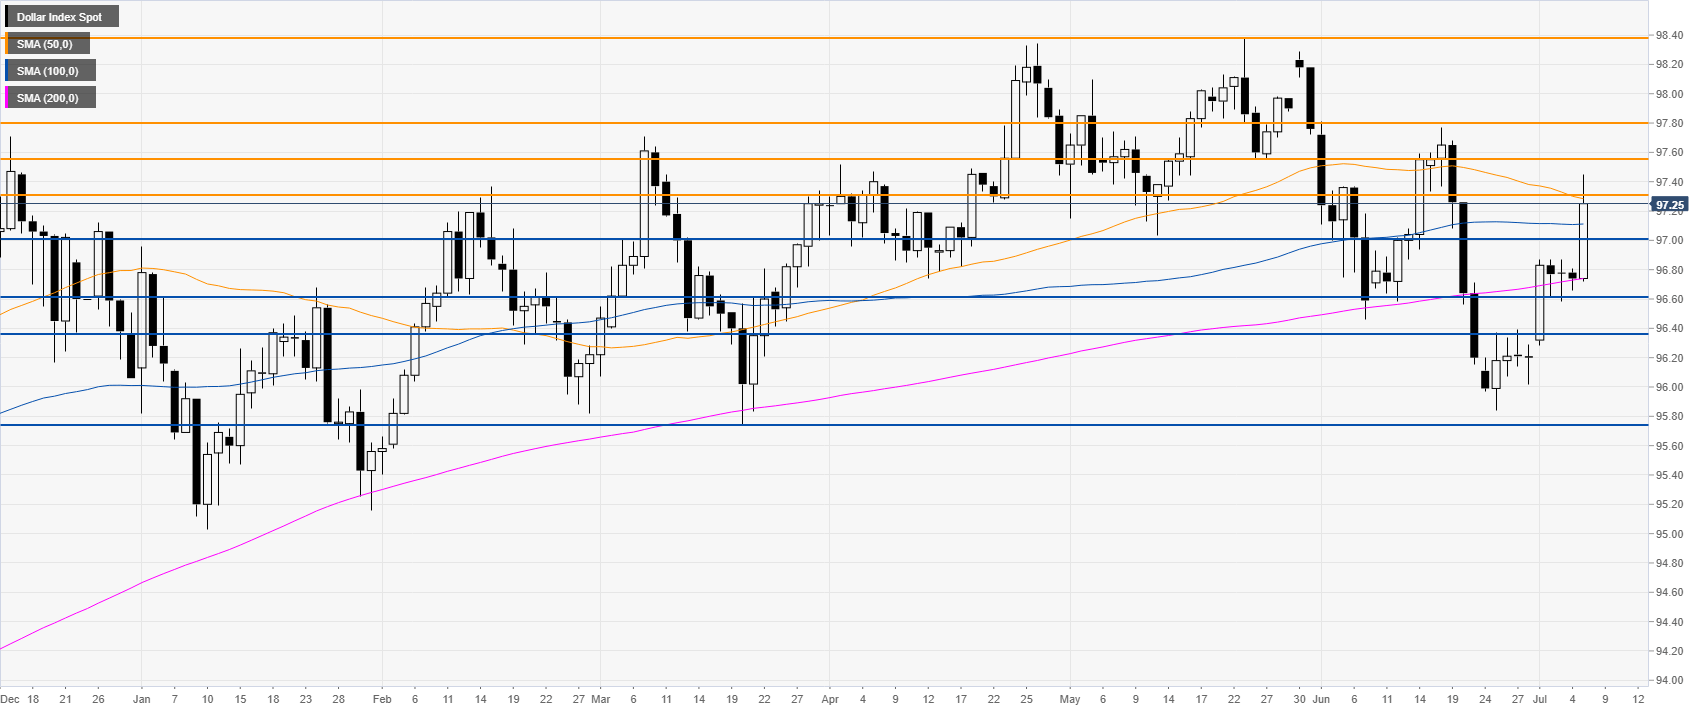
DXY daily chart
The US Dollar Index (DXY) is trading just below the 97.30 resistance and the 50-day simple moving average (DSMA). Bulls should break above the 97.55 figure to prevent a decline below the 97.00 figure.
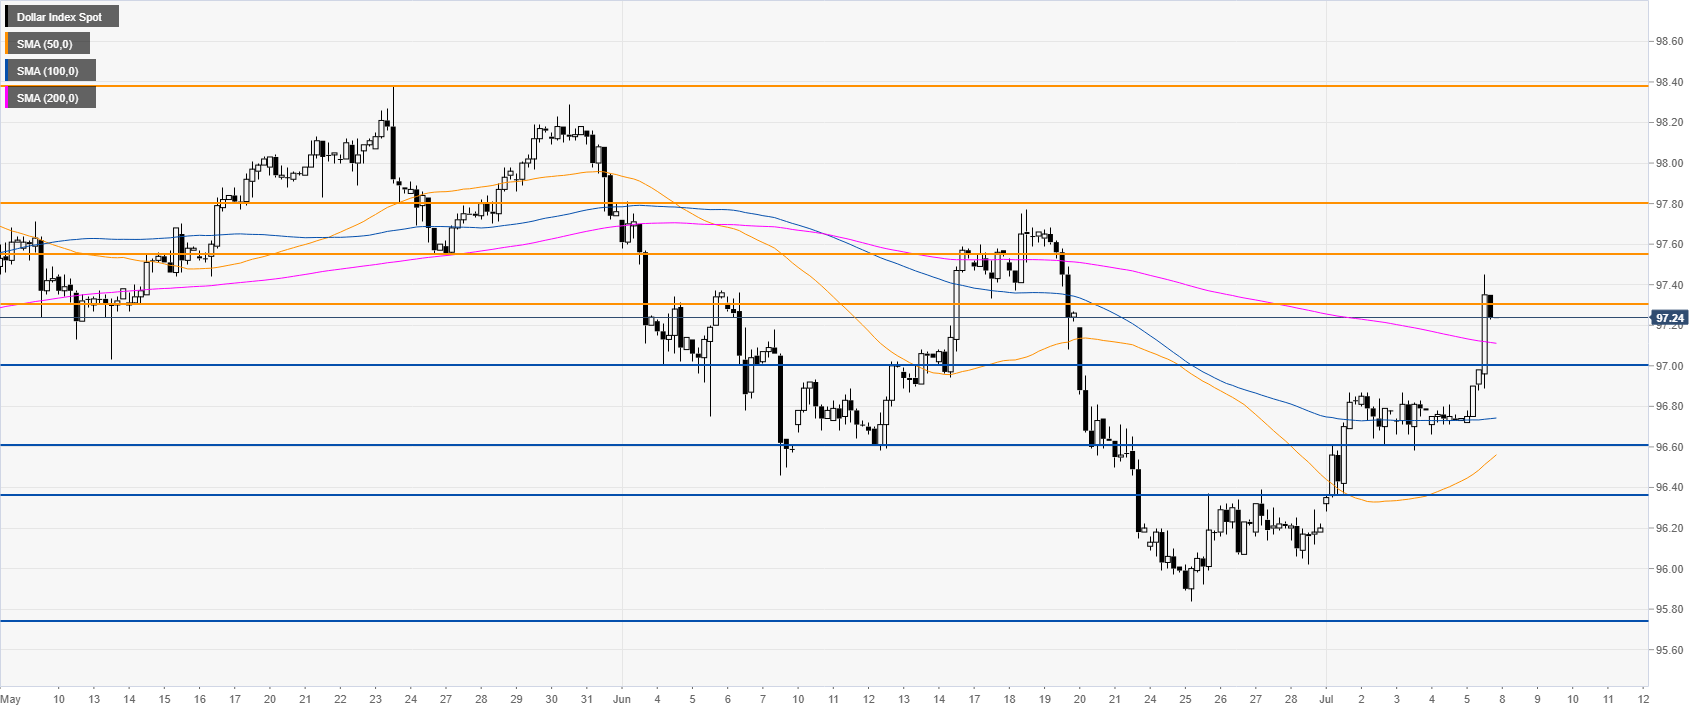
DXY 4-hour chart
The market is consolidating some of its recent gains below the 97.30 resistance. DXY broke above the descending 200 SMA, which is potentially bullish. However, bulls must keep the market above the 97.00 figure which becomes a key support. Targets to the upside can be seen near 97.55, 97.80 and 98.38.

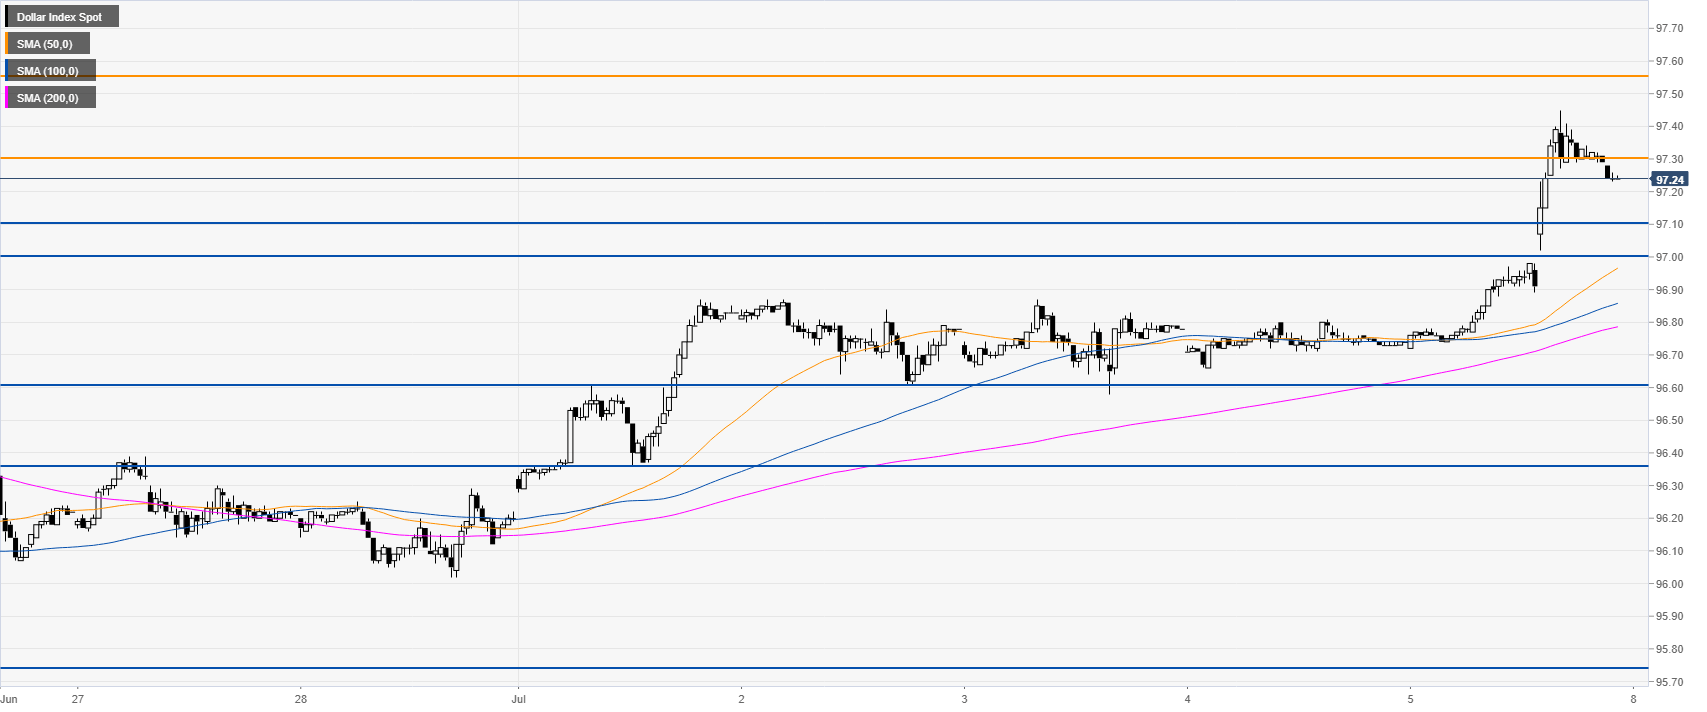
DXY 30-minute chart
The market is trading well above its main SMAs. 97.10 and 97.00 can provide initial support. However a daily close below 97.00 could see a move down to 96.36.
Additional key levels