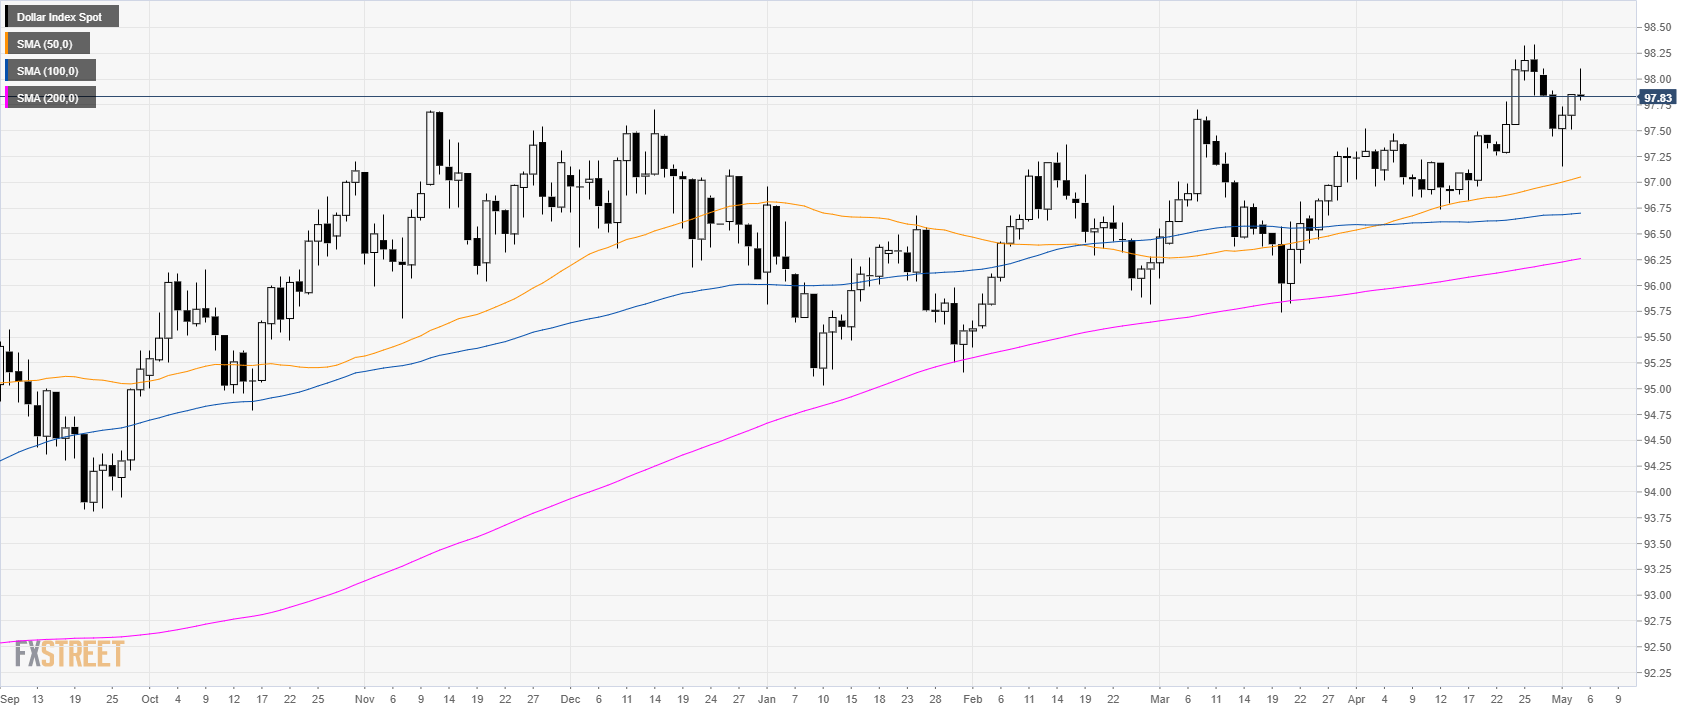
DXY daily chart
- The US Dollar Index (DXY) is trading in a bull trend above its main simple moving averages (SMAs).
- The greenback is being sold despite better-than-anticipated Nonfarm Payrolls (NFP) data in April at 3.2% vs. 3.3% while the Average Hourly Earnings came in slightly lower than expected at 3.2% vs. 3.3% YoY in April.
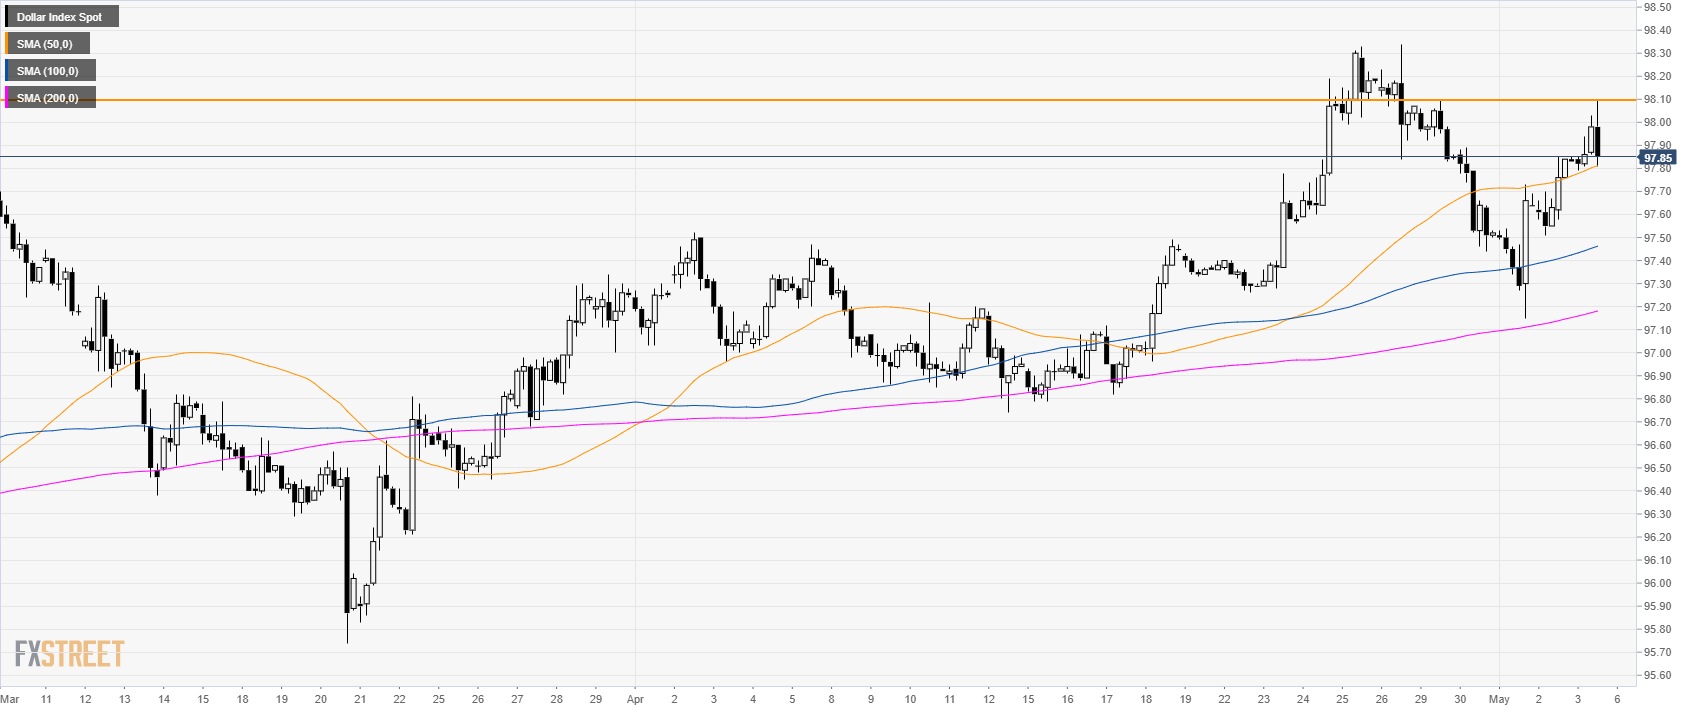
DXY 4-hour chart
- Yesterday, I mentioned 98.10 as the main bull target and it got hit to the tick today on the NFP.
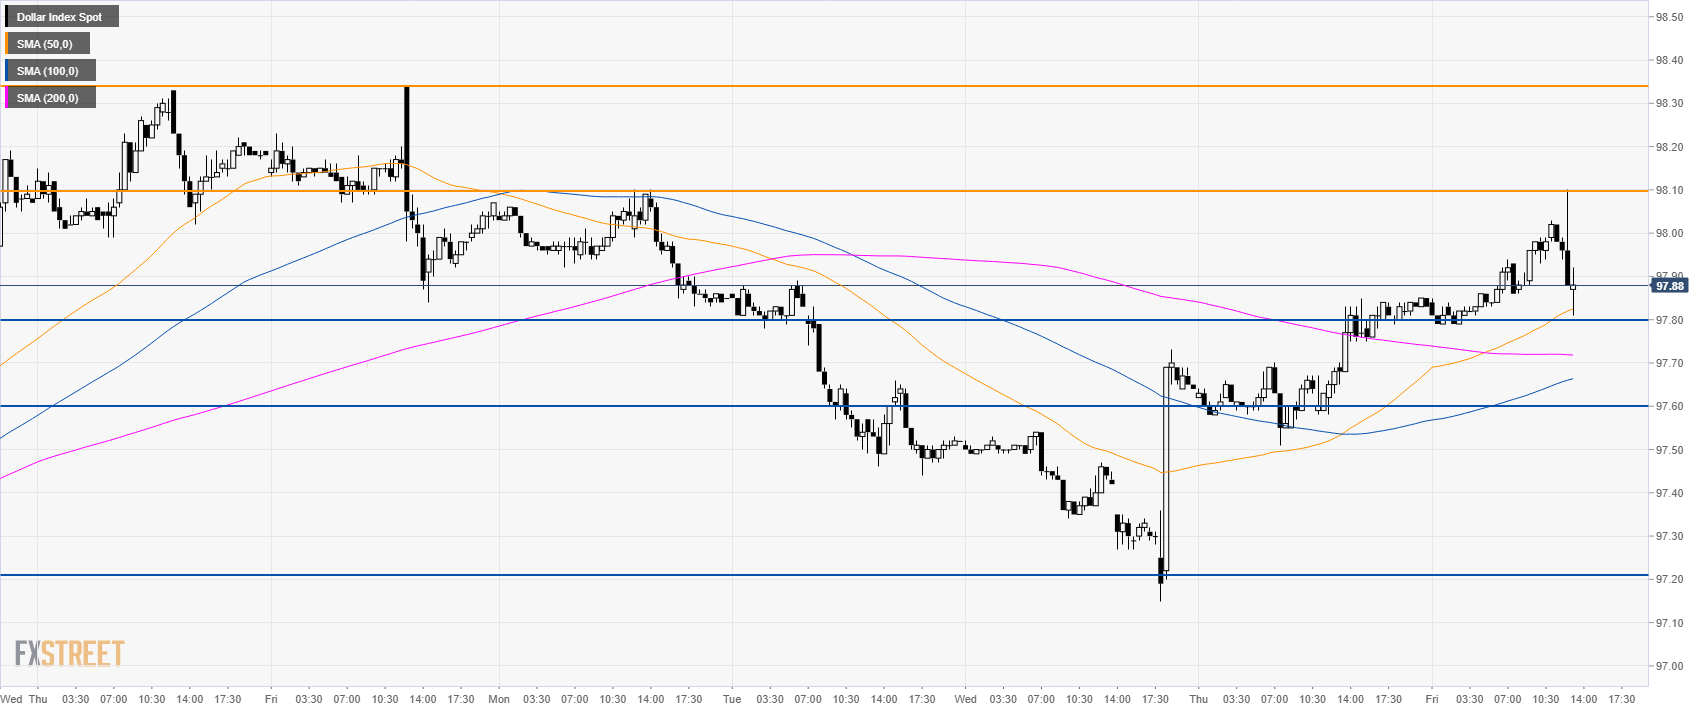
DXY 30-minute chart
- DXY is strongly rejecting 98.10 resistance while the market is trading above its main SMAs, suggesting that the market is in a consolidation phase.
- A break below 97.80 support can, lead to further losses to 97.60 and potentially to 97.20 if the bears gather enough steam.
- The level to beat for bulls is 98.10 after which 98.34 resistance comes into play.
Additional key levels
