- 97.11/09 support-confluence, 11-day old ascending trend-line can limit the immediate downside of the DXY.
- Sustained trading beyond 97.41 enables buyers to aim for 97.80.
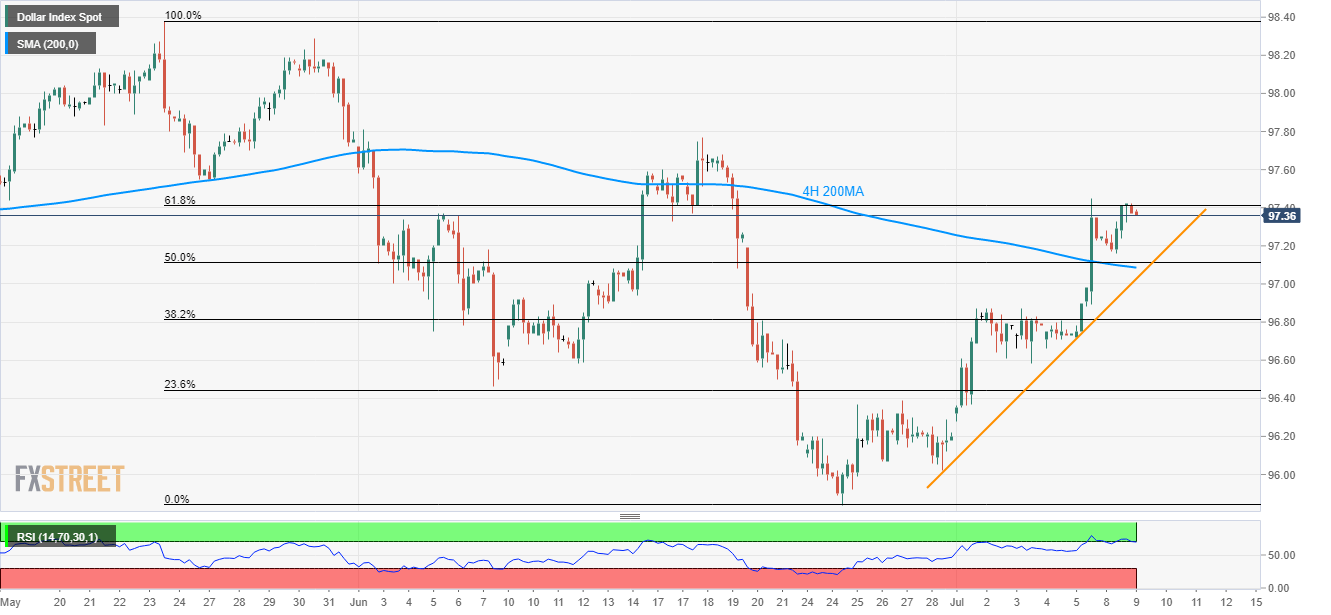
Failure to cross the 61.8% Fibonacci retracement of late-May to June downpour drags the US Dollar Index (DXY) as it takes the rounds to 97.36 during early Tuesday.
In addition to the U-turn from key resistance, overbought levels of 14-bar relative strength index (RSI) also signal further downside of the greenback gauge.
The 97.11/09 support confluence comprising 200-bar moving average (4H 200MA) and 50% Fibonacci retracement offers immediate support, a break of which can drag the quote to near-term ascending trend-line around 97.00.
In a case where the quote slips beneath 97.00, early month high around 96.87, June 27 top surrounding 96.40 and the previous month low around 95.84 may come back on the chart.
On the contrary, an upside clearance of 97.41 mark encompassing 61.8% Fibonacci retracement can propel the prices further up towards mid-June highs close to 97.80 whereas 98.30/40 could be on the bulls’ radar afterward.
DXY 4-hour chart
Trend: Pullback expected
