- US President Trump announces additional tariffs on China sending USD down.
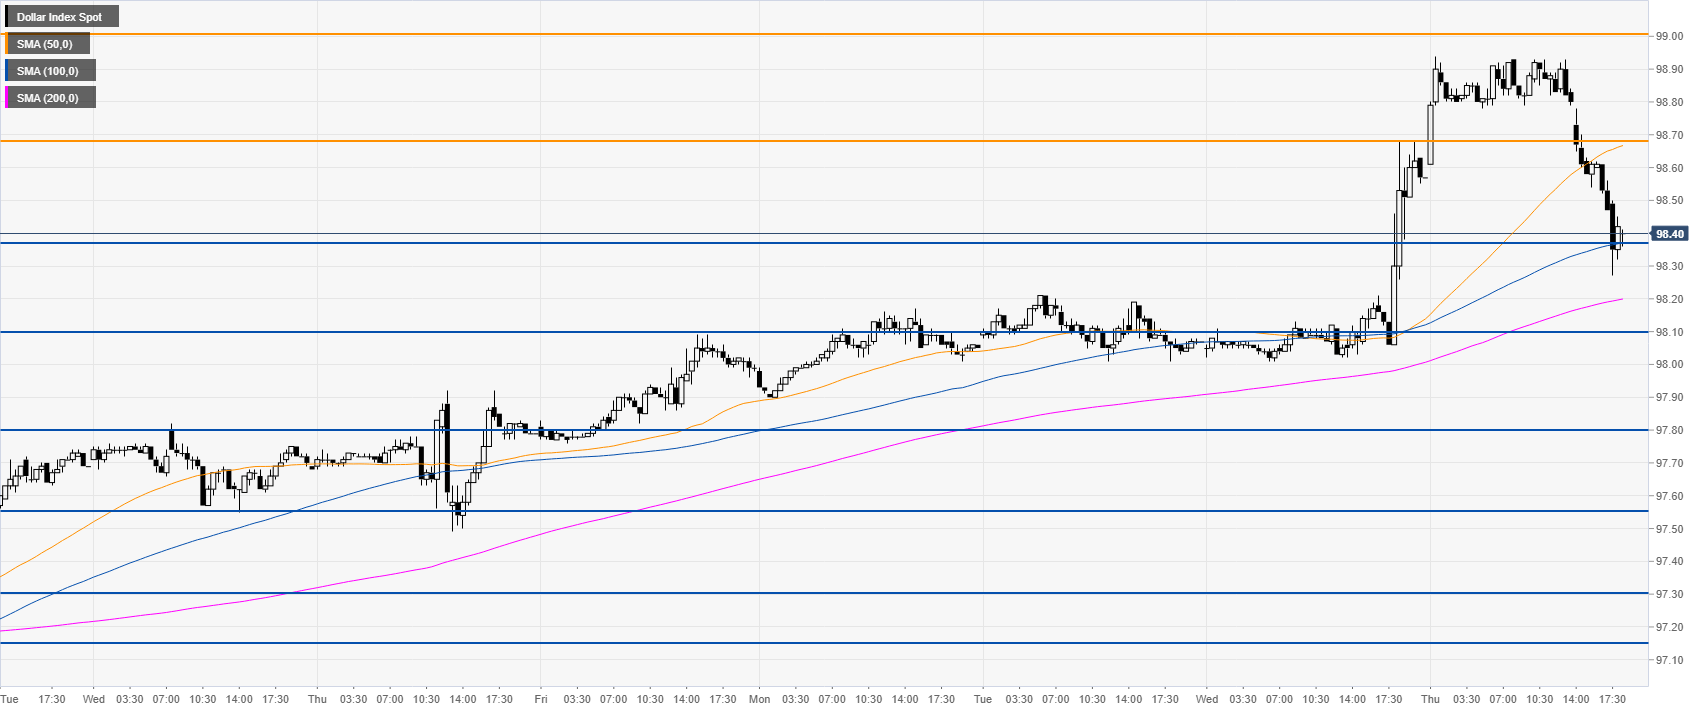
- The correction down can reach 98.38, 98.10 and potentially 97.80.
DXY daily chart
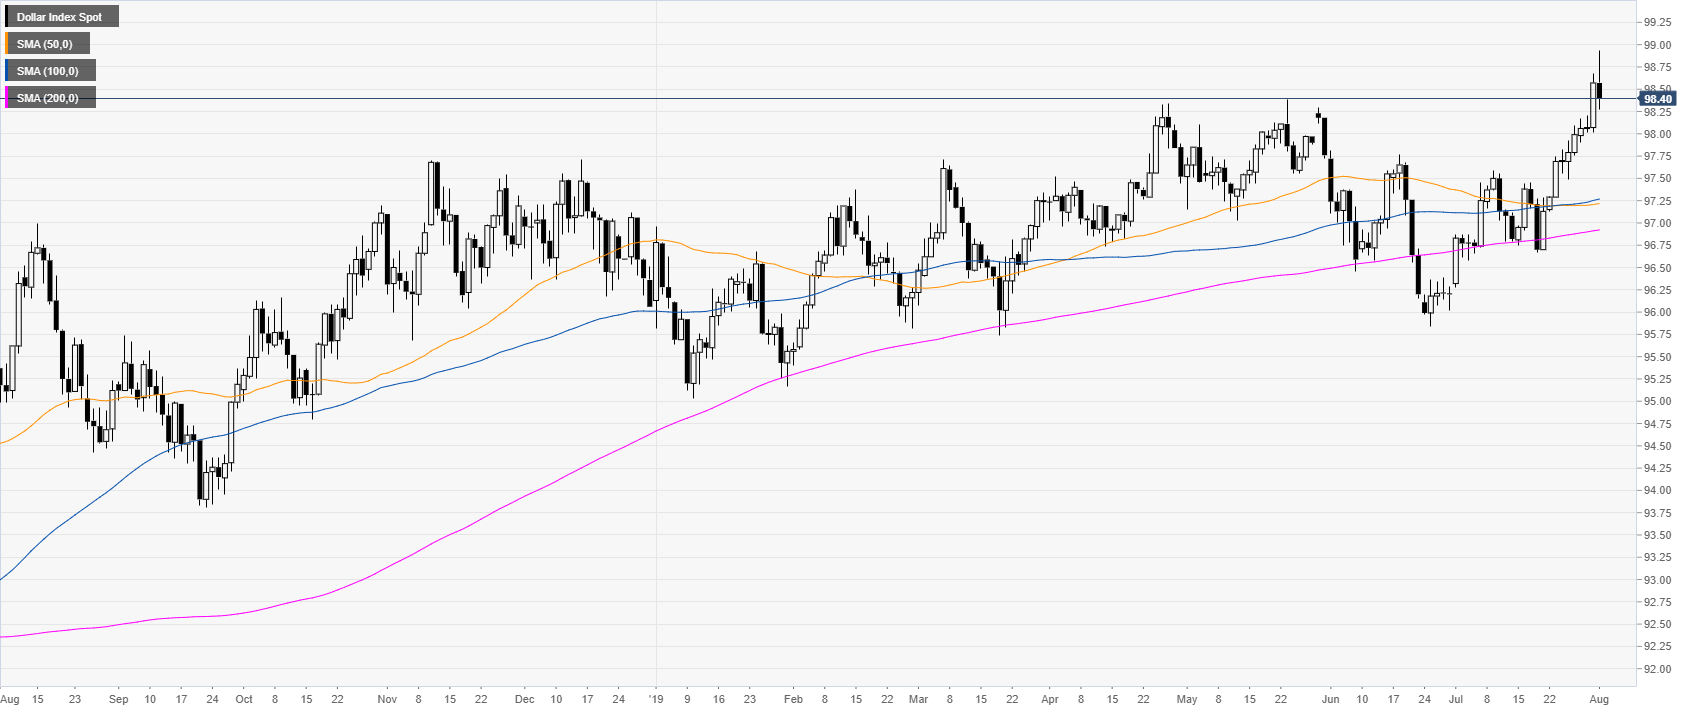
DXY (US Dollar Index) is trading in a bull trend above its main daily simple moving averages (DSMAs). On Wednesday DXY rose as the Federal Reserve made a hawkish cut of 25bps. This Thursday US President Trump announced new tariffs on China, sending USD down across the board. Interestingly, Fed’s Chair Powell said the trade war was the reason for the interest rate cut.
DXY 4-hour chart
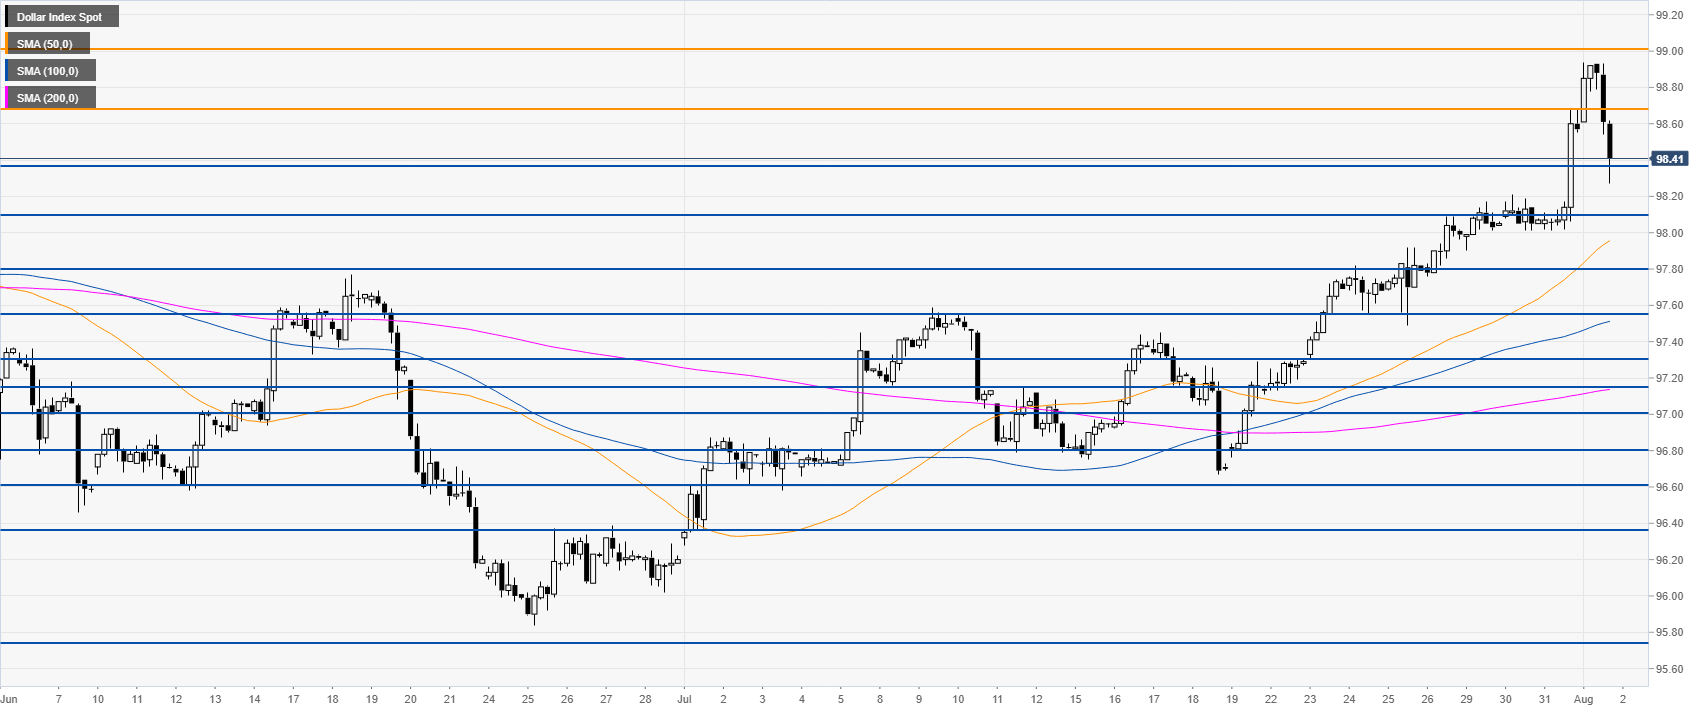
DXY is trading above its main SMAs, suggesting bullish momentum in the medium term. However the market is retracing down sharply and the bulls would need to regain the 98.68 resistance to trade towards 98.93, the 2019 high.
DXY 30-minute chart
DXY is testing the 98.38 support and the 100 SMA while trading below the 50 SMA, all-in-all suggesting a correction down in the near term. The move down can extend towards 98.38, 98.10 and 97.80 if the bears gather enough steam.
Additional key levels


