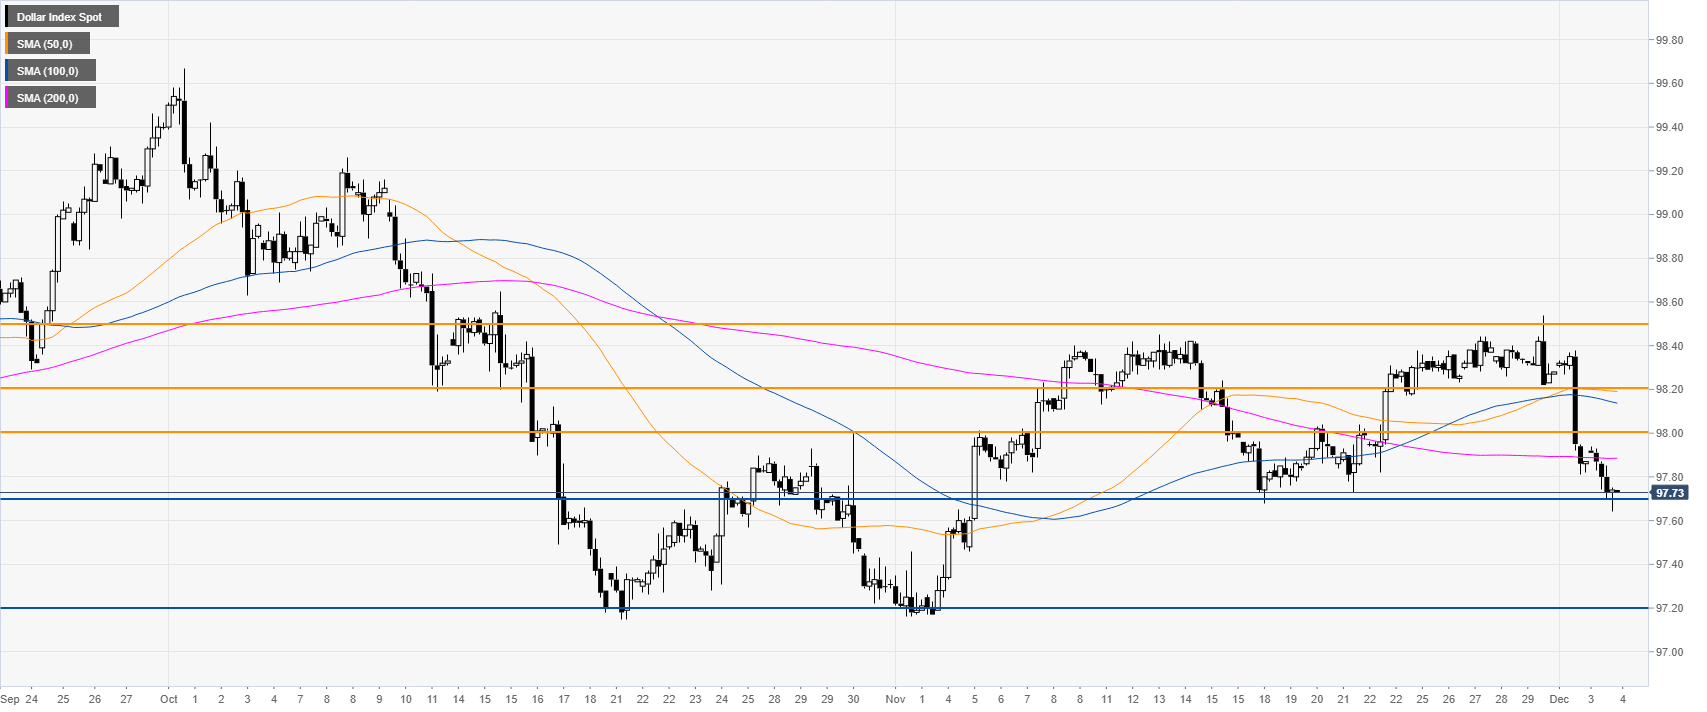
- DXY is challenging the 97.70 key support level and the 200 DMA.
- The 97.20 level seems to be on the bears’ radar in the medium term.
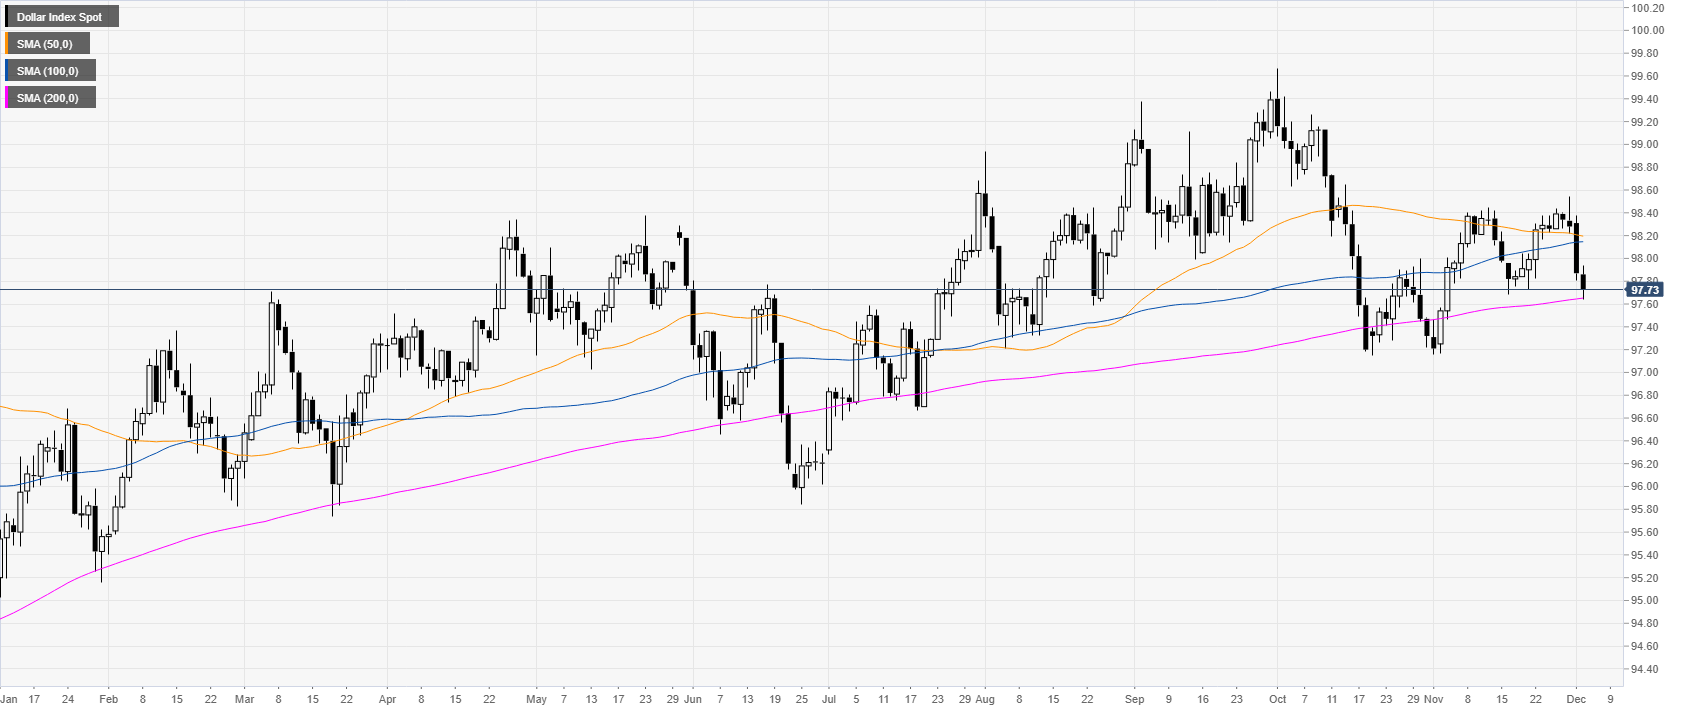
DXY daily chart
DXY (US Dollar Index) is trading in a bull trend just above the 200-day simple moving averages (DMA). However, the market is becoming increasingly weak and vulnerable to the downside as the risk-off is diminishing the demand for US dollars.
DXY four-hour chart
DXY is challenging critical support at the 97.70 level while trading below the main SMAs. Bears will be looking to push the market below this level. If the breakdown is successful, the market could start to decline towards the 97.20 support level in the medium term.
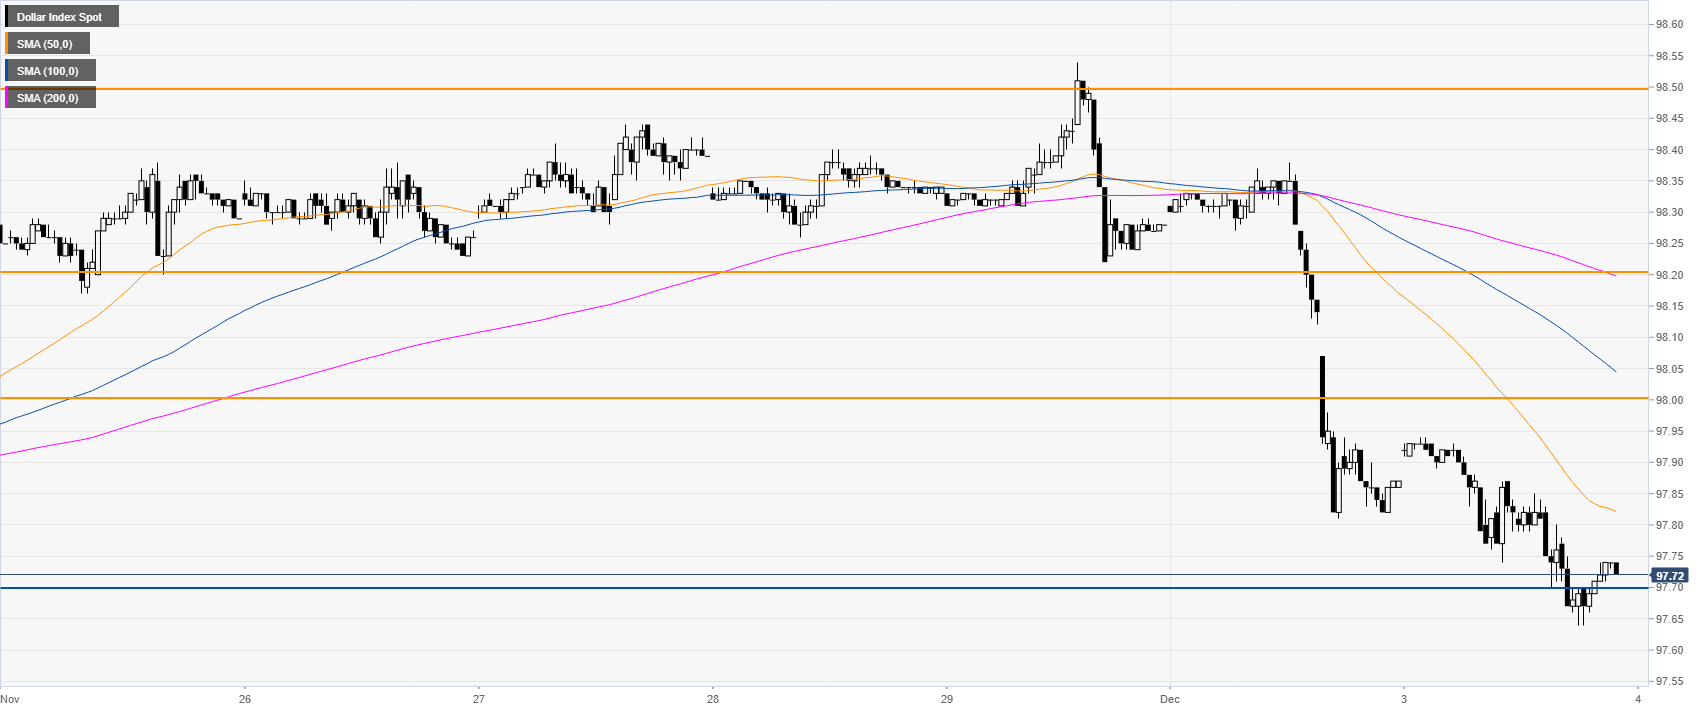
DXY 30-minute chart
The picture on the 30-minute chart remains bearish as well with the greenback under pressure below its main SMAs. Resistance can be seen near the 98.00 and 98.20 levels.
Additional key levels
