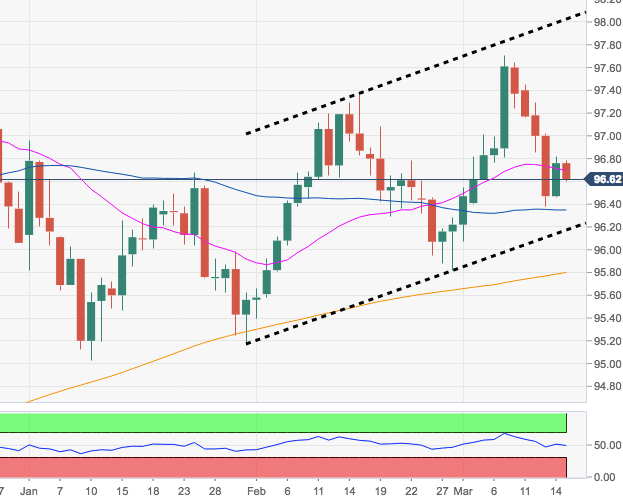
- The weekly correction lower in the greenback appears to have found decent contention just ahead of the 55-day SMA near 96.30.
- A breakdown of this area is expected to test the 95.80 region. Late-February lows and the critical 200-day SMA reinforce this area.
- In this regard, the positive outlook on the index is expected to persist as long as the 200-day SMA underpins.
DXY daily chart
Dollar Index Spot
Overview:
Today Last Price: 96.61
Today Daily change: 18 pips
Today Daily change %: -0.16%
Today Daily Open: 96.76
Trends:
Daily SMA20: 96.7
Daily SMA50: 96.34
Daily SMA100: 96.58
Daily SMA200: 95.79
Levels:
Previous Daily High: 96.82
Previous Daily Low: 96.46
Previous Weekly High: 97.71
Previous Weekly Low: 96.4
Previous Monthly High: 97.37
Previous Monthly Low: 95.4
Daily Fibonacci 38.2%: 96.68
Daily Fibonacci 61.8%: 96.6
Daily Pivot Point S1: 96.54
Daily Pivot Point S2: 96.32
Daily Pivot Point S3: 96.18
Daily Pivot Point R1: 96.9
Daily Pivot Point R2: 97.04
Daily Pivot Point R3: 97.26
