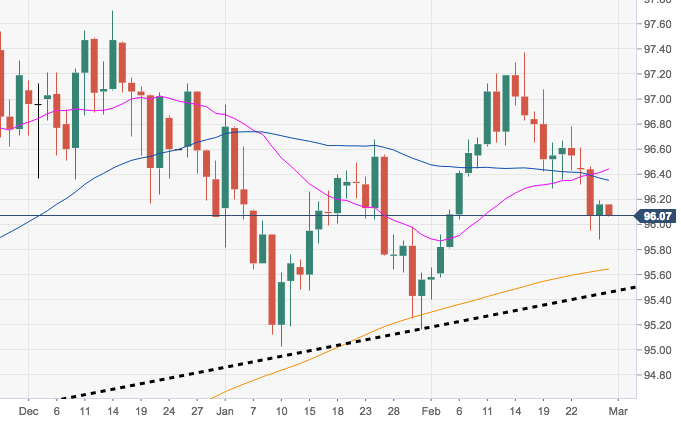
- The weekly pullback in DXY appears to have met decent contention in the 95.90/80 band, just ahead of the 50% Fibo retracement of the September-December up move at 95.76.
- The current bearish note carries the potential to visit the critical 200-day SMA, today at 95.64.
- On the broader picture, as long as the 200-day SMA holds the downside, the constructive outlook should persist. This view is also reinforced by the short-term support line at 95.45.
DXY daily chart
Dollar Index Spot
Overview:
Today Last Price: 96.09
Today Daily change: 9 pips
Today Daily change %: -0.07%
Today Daily Open: 96.16
Trends:
Daily SMA20: 96.46
Daily SMA50: 96.29
Daily SMA100: 96.44
Daily SMA200: 95.63
Levels:
Previous Daily High: 96.19
Previous Daily Low: 95.88
Previous Weekly High: 97.08
Previous Weekly Low: 96.29
Previous Monthly High: 96.96
Previous Monthly Low: 95.03
Daily Fibonacci 38.2%: 96.07
Daily Fibonacci 61.8%: 96
Daily Pivot Point S1: 95.96
Daily Pivot Point S2: 95.77
Daily Pivot Point S3: 95.65
Daily Pivot Point R1: 96.27
Daily Pivot Point R2: 96.39
Daily Pivot Point R3: 96.58
