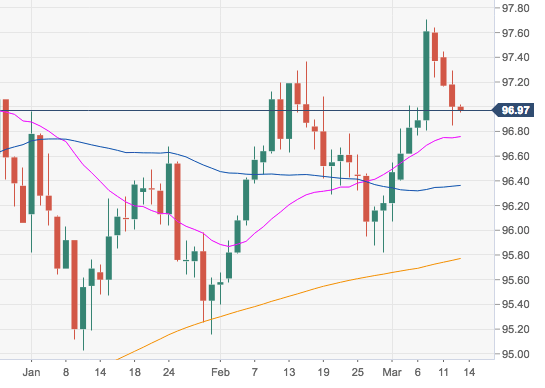
- The greenback remains under pressure so far this week, although the downside seems to have found contention in the 96.90 region, where is located the key 10-day SMA.
- Further south, the 96.74/33 band should offer interim support, home of the 21-day, 100-day and 55-day SMAs.
- Looking at the broader scenario, another test of 2019 highs around 97.70 remains well on the cards while underpinned by the 200-day SMA at 95.77 and 95.82 (late February low).
DXY daily chart
Dollar Index Spot
Overview:
Today Last Price: 96.97
Today Daily change: 7 pips
Today Daily change %: -0.03%
Today Daily Open: 97
Trends:
Daily SMA20: 96.75
Daily SMA50: 96.34
Daily SMA100: 96.57
Daily SMA200: 95.76
Levels:
Previous Daily High: 97.29
Previous Daily Low: 96.85
Previous Weekly High: 97.71
Previous Weekly Low: 96.4
Previous Monthly High: 97.37
Previous Monthly Low: 95.4
Daily Fibonacci 38.2%: 97.02
Daily Fibonacci 61.8%: 97.12
Daily Pivot Point S1: 96.8
Daily Pivot Point S2: 96.61
Daily Pivot Point S3: 96.36
Daily Pivot Point R1: 97.24
Daily Pivot Point R2: 97.49
Daily Pivot Point R3: 97.68
