Home US Dollar Index Technical Analysis: The greenback remains supported by the 200-day SMA and the resistance line
FXStreet News

US Dollar Index Technical Analysis: The greenback remains supported by the 200-day SMA and the resistance line

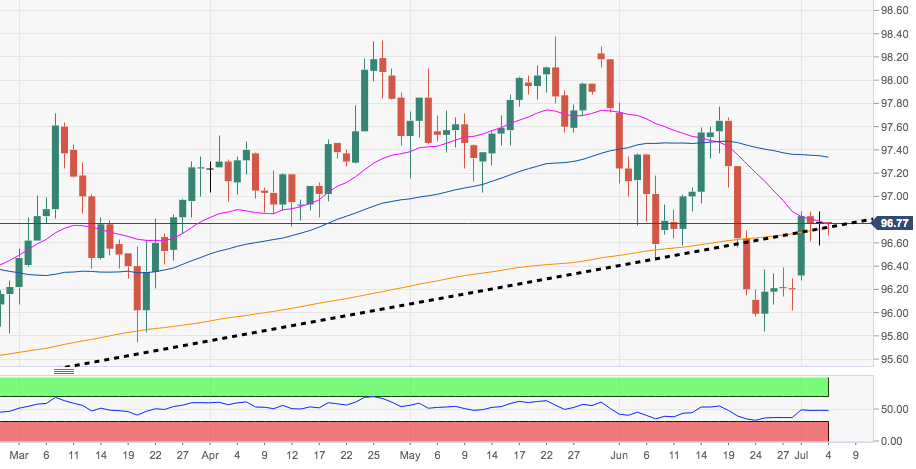
  • DXY is trading a tad below recent tops in the boundaries of 96.90, challenging the critical support at the 200-day SM in the 96.60 region.
  • This significant area of contention is also reinforced by the multi-month resistance line, today at 96.73.
  • Immediately above emerges the 100-day SMA at 97.08 ahead of the 55-day SMA at 97.31, considered interim hurdles and the last defence of a test of June tops near 97.80.

DXY daily chart


FX Street

FX Street

FXStreet is the leading independent portal dedicated to the Foreign Exchange (Forex) market. It was launched in 2000 and the portal has always been proud of their unyielding commitment to provide objective and unbiased information, to enable their users to take better and more confident decisions.