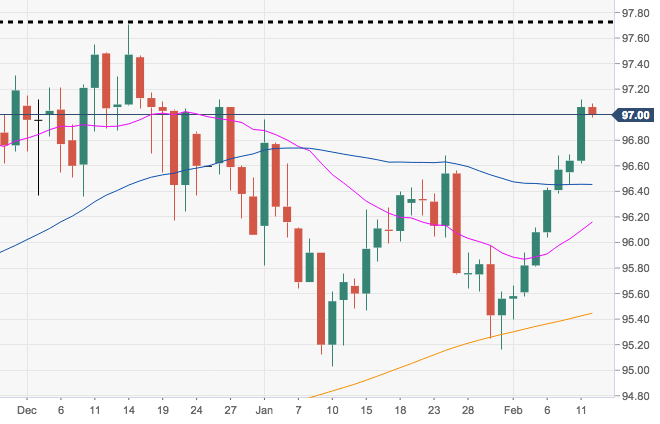
- The rally in the greenback is now taking a break in the 97.00 area after hitting fresh yearly tops in the 97.10/15 band on Monday.
- The current constructive view on DXY allows for the up move to advance further, targeting 2018 highs around 97.70 recorded in mid-December.
- The positive outlook on the buck remains underpinned by the 200-day SMA at 95.45 and is also reinforced by a Fibo retracement of the September-December rally at 95.30.
DXY daily chart
Dollar Index Spot
Overview:
Today Last Price: 97.04
Today Daily change: 11 pips
Today Daily change %: -0.02%
Today Daily Open: 97.06
Trends:
Daily SMA20: 96.12
Daily SMA50: 96.4
Daily SMA100: 96.27
Daily SMA200: 95.43
Levels:
Previous Daily High: 97.12
Previous Daily Low: 96.62
Previous Weekly High: 96.69
Previous Weekly Low: 95.58
Previous Monthly High: 96.96
Previous Monthly Low: 95.03
Daily Fibonacci 38.2%: 96.93
Daily Fibonacci 61.8%: 96.81
Daily Pivot Point S1: 96.75
Daily Pivot Point S2: 96.43
Daily Pivot Point S3: 96.25
Daily Pivot Point R1: 97.25
Daily Pivot Point R2: 97.43
Daily Pivot Point R3: 97.75
