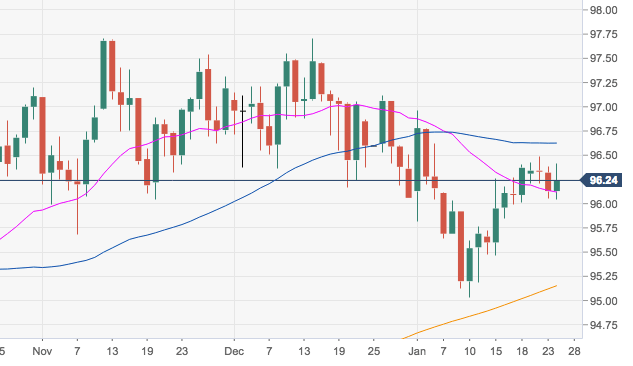
- The greenback is coming up after briefly testing fresh weekly lows in the 96.00 handle, although a clear breakout of the key resistance area in the mid-96.00s still remains elusive.
- DXY still needs to overcome the 96.50/80 band, where are located recent peaks, the key 55-day SMA and the 23.6% Fibo retracement of the September-December up move.
- A move higher should put the YTD highs around 97.00 back on the investors’ radar.
DXY daily chart
Dollar Index Spot
Overview:
Today Last Price: 96.25
Today Daily change: 0.12 pips
Today Daily change %: 0.12%
Today Daily Open: 96.13
Trends:
Daily SMA20: 96.11
Daily SMA50: 96.6
Daily SMA100: 96.1
Daily SMA200: 95.12
Levels:
Previous Daily High: 96.38
Previous Daily Low: 96.05
Previous Weekly High: 96.4
Previous Weekly Low: 95.47
Previous Monthly High: 97.71
Previous Monthly Low: 96.06
Daily Fibonacci 38.2%: 96.18
Daily Fibonacci 61.8%: 96.25
Daily Pivot Point S1: 95.99
Daily Pivot Point S2: 95.86
Daily Pivot Point S3: 95.66
Daily Pivot Point R1: 96.32
Daily Pivot Point R2: 96.52
Daily Pivot Point R3: 96.65
