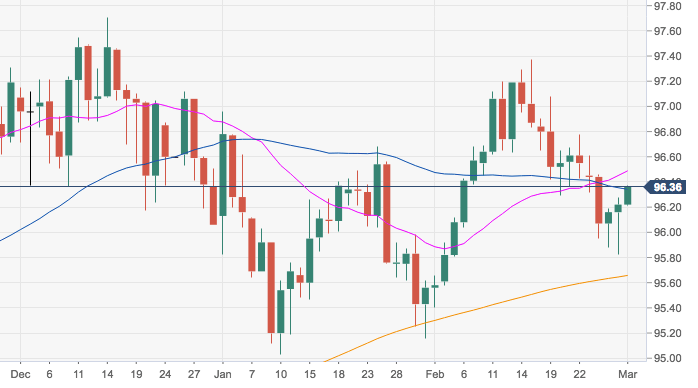
- The index has managed to bounce off recent 3-week lows in the 95.80 region and has regained the 96.00 handle and above.
- Extra gains should meet a moderate hurdle in the 96.40/50 band, where converge the 10-, 100- and 21-say SMAs.
- Provided the greenback stays above the critical 200-day SMA at 95.65, the likeliness of the continuation of the up move remains well on the cards.
DXY daily chart
Dollar Index Spot
Overview:
Today Last Price: 96.37
Today Daily change: 16 pips
Today Daily change %: 0.16%
Today Daily Open: 96.22
Trends:
Daily SMA20: 96.49
Daily SMA50: 96.27
Daily SMA100: 96.44
Daily SMA200: 95.64
Levels:
Previous Daily High: 96.28
Previous Daily Low: 95.82
Previous Weekly High: 97.08
Previous Weekly Low: 96.29
Previous Monthly High: 97.37
Previous Monthly Low: 95.4
Daily Fibonacci 38.2%: 96.1
Daily Fibonacci 61.8%: 96
Daily Pivot Point S1: 95.93
Daily Pivot Point S2: 95.65
Daily Pivot Point S3: 95.47
Daily Pivot Point R1: 96.39
Daily Pivot Point R2: 96.57
Daily Pivot Point R3: 96.85
