- The US Dollar Index (DXY) is trading at five-day highs as the recovery is gaining some momentum.
- The next resistances on the way up are seen near 97.90 and 98.20 price levels.
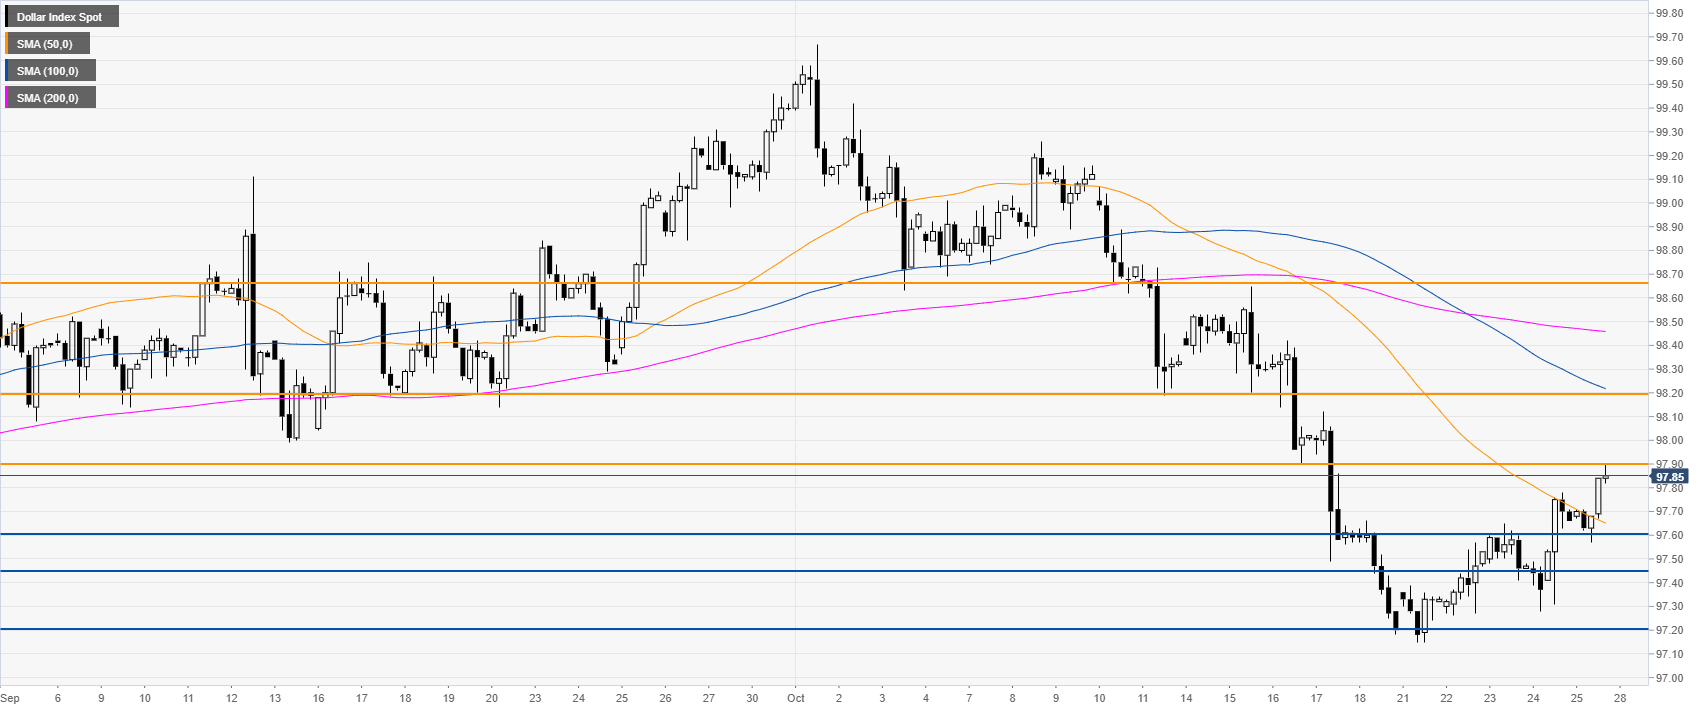
DXY daily chart
The US Dollar Index (DXY) is trading above its 200-day simple moving average (DMA) after a sharp pullback down. This Friday, the buck traded as high as 97.90, reaching to the tick the resistance level mentioned on Thursday. The market will need to surpass the 100 DMA near the above-mentioned resistance.

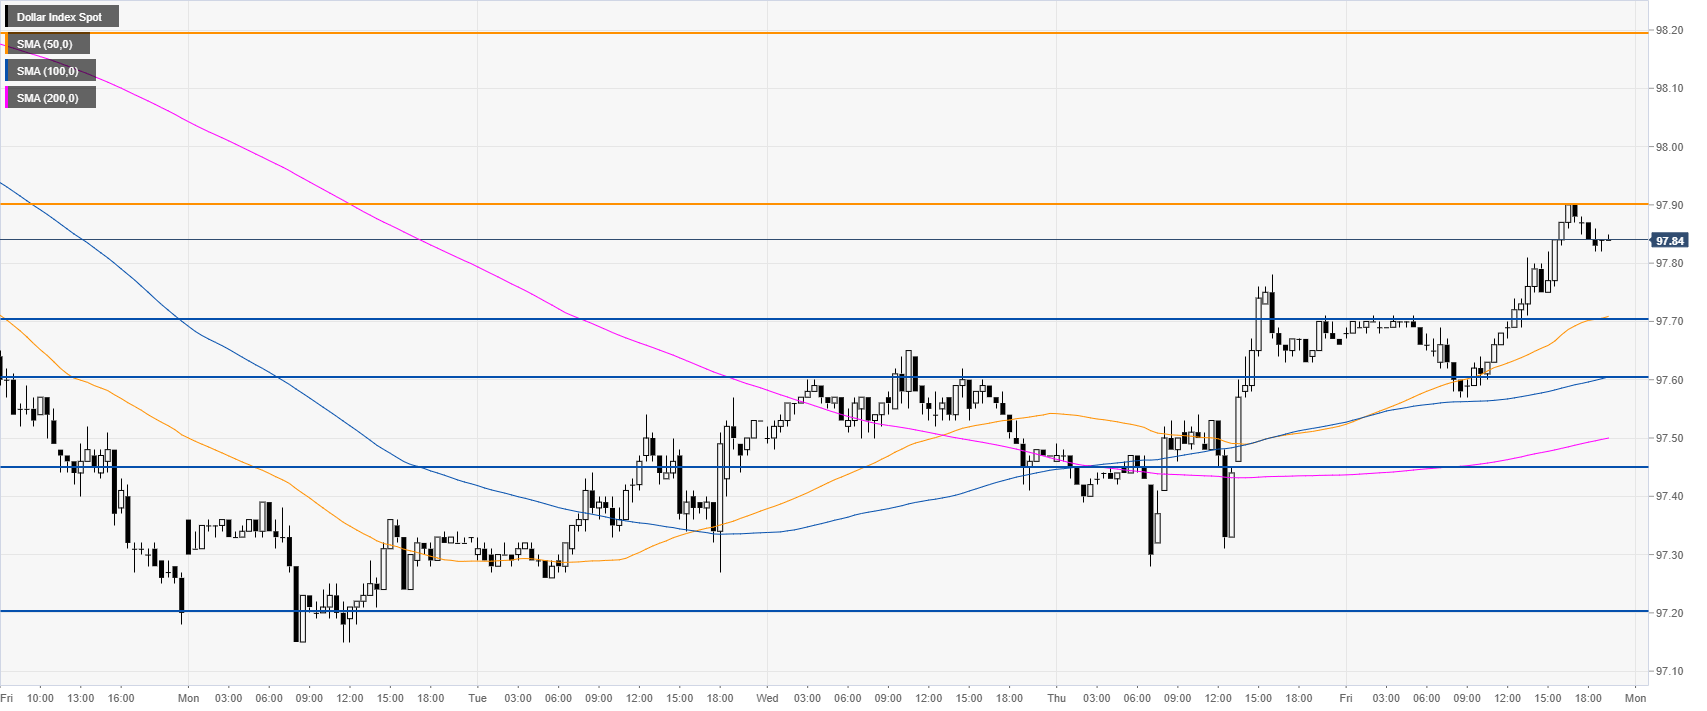
DXY four-hour chart
On the four-hour chart, DXY broke above the downward sloping 50 SMA. The recovery is gaining some momentum and the next week the market will need to break 97.90 to potentially reach 98.20 and 98.66 price levels on the way up.
DXY 30-minute chart
DXY is trading above its main SMAs, suggesting a bullish bias in the short term. Support is seen in the 97.60/70 zone and at the 97.45 level.
Additional key levels
