Home US Dollar Index Technical Analysis: The weekly range appears supported by the 21-day SMA
FXStreet News

US Dollar Index Technical Analysis: The weekly range appears supported by the 21-day SMA

  • DXY has faded the optimism seen at the beginning of the week and is now back to the 98.90/80 region.
  • The 21-day SMA at 98.71 continues to underpin the price action in the Greenback for the time being, although DXY needs to surpass the 10-day SMA just above 99.00 the figure to re-assert the bullish view.
  • Immediately above emerges the initial resistance at early September peak at 99.37 seconded by the 2019 high near 99.70.
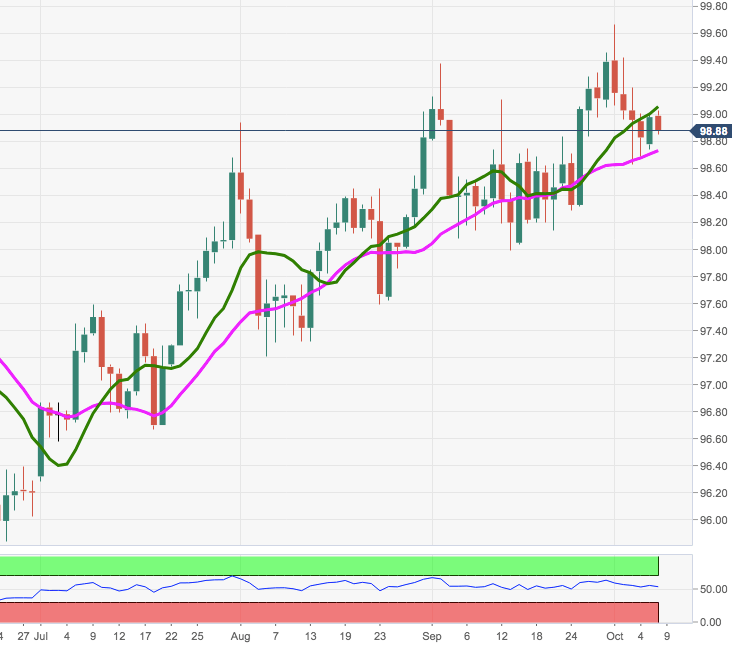
DXY daily chart


FX Street

FX Street

FXStreet is the leading independent portal dedicated to the Foreign Exchange (Forex) market. It was launched in 2000 and the portal has always been proud of their unyielding commitment to provide objective and unbiased information, to enable their users to take better and more confident decisions.