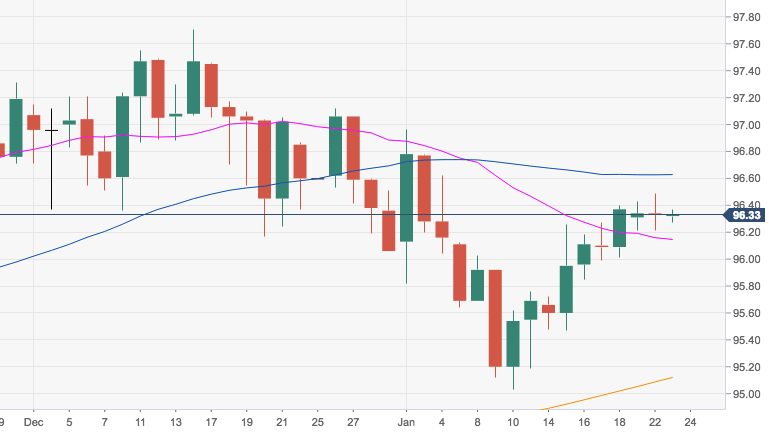
- DXY has faded Tuesday’s up move to the mid-96.00s, clinching at the same time fresh 3-week highs, and has now returned to the new comfort zone around 96.30.
- The greenback now needs to surpass the 96.60 level, where sits the 55-day SMA, and the 23.6% Fibo retracement of the September-December up move at 96.79 to allow for a re-test of 2019 highs in the boundaries of 97.00 the figure.
- On the downside, the 96.10/96.00 band emerges as a key support, where converge the 21-, 100- and 10-day SMAs
DXY daily chart
Dollar Index Spot
Overview:
Today Last Price: 96.3
Today Daily change: -0.03 pips
Today Daily change %: -0.03%
Today Daily Open: 96.33
Trends:
Daily SMA20: 96.14
Daily SMA50: 96.62
Daily SMA100: 96.09
Daily SMA200: 95.09
Levels:
Previous Daily High: 96.49
Previous Daily Low: 96.21
Previous Weekly High: 96.4
Previous Weekly Low: 95.47
Previous Monthly High: 97.71
Previous Monthly Low: 96.06
Daily Fibonacci 38.2%: 96.32
Daily Fibonacci 61.8%: 96.38
Daily Pivot Point S1: 96.2
Daily Pivot Point S2: 96.06
Daily Pivot Point S3: 95.92
Daily Pivot Point R1: 96.48
Daily Pivot Point R2: 96.62
Daily Pivot Point R3: 96.76
