- The US Dollar Index (DXY) is under heavy bearish pressure as the market prints its worst weekly decline since mid-June 2019.
- This Friday, the negative sentiment on the Greenback sent the Index down to the critical 200-day simple moving average.
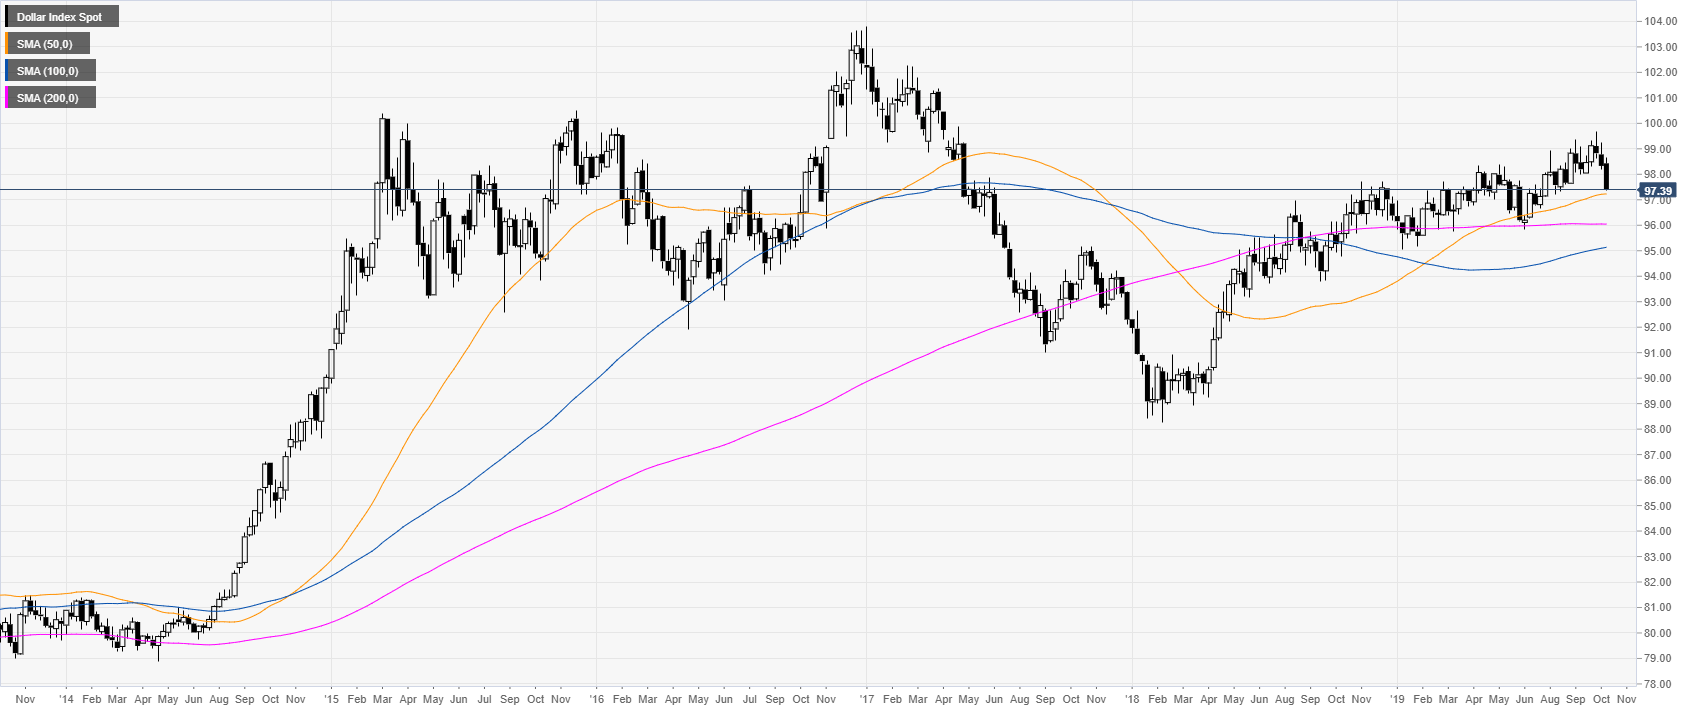
DXY weekly chart
The US Dollar Index (DXY) had its worst weekly decline since June 2019. However, the Index is still trading above its main SMAs (simple moving averages), suggesting that the bull trend is still in place for now.
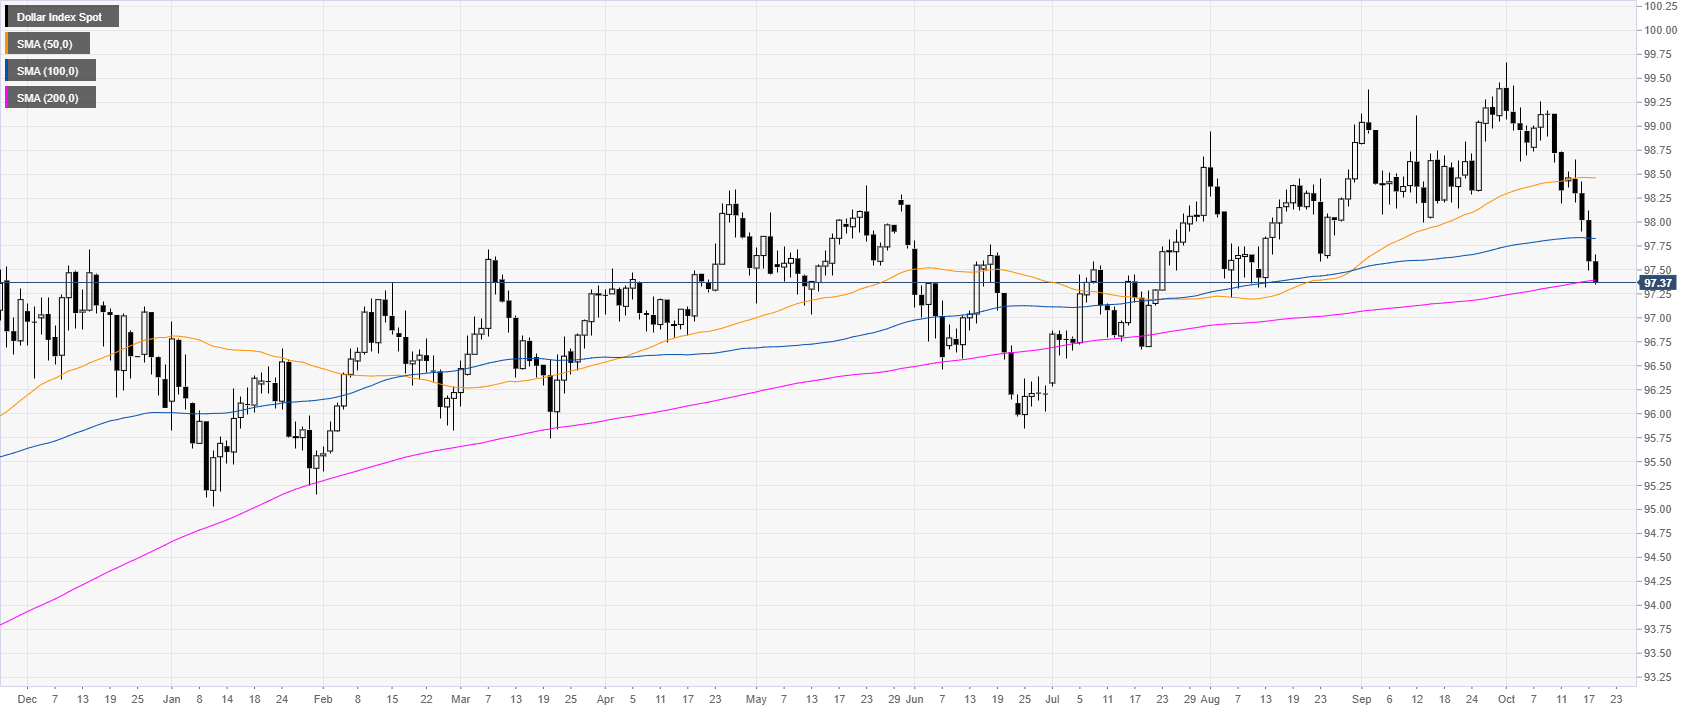
DXY daily chart
The drop in the Greenback this week saw the Index breaking below both the 50 and 100 SMAs. Now it is the 200 SMA which is being put to the test. Next week, it will be interesting to see how the market reacts around this important level.
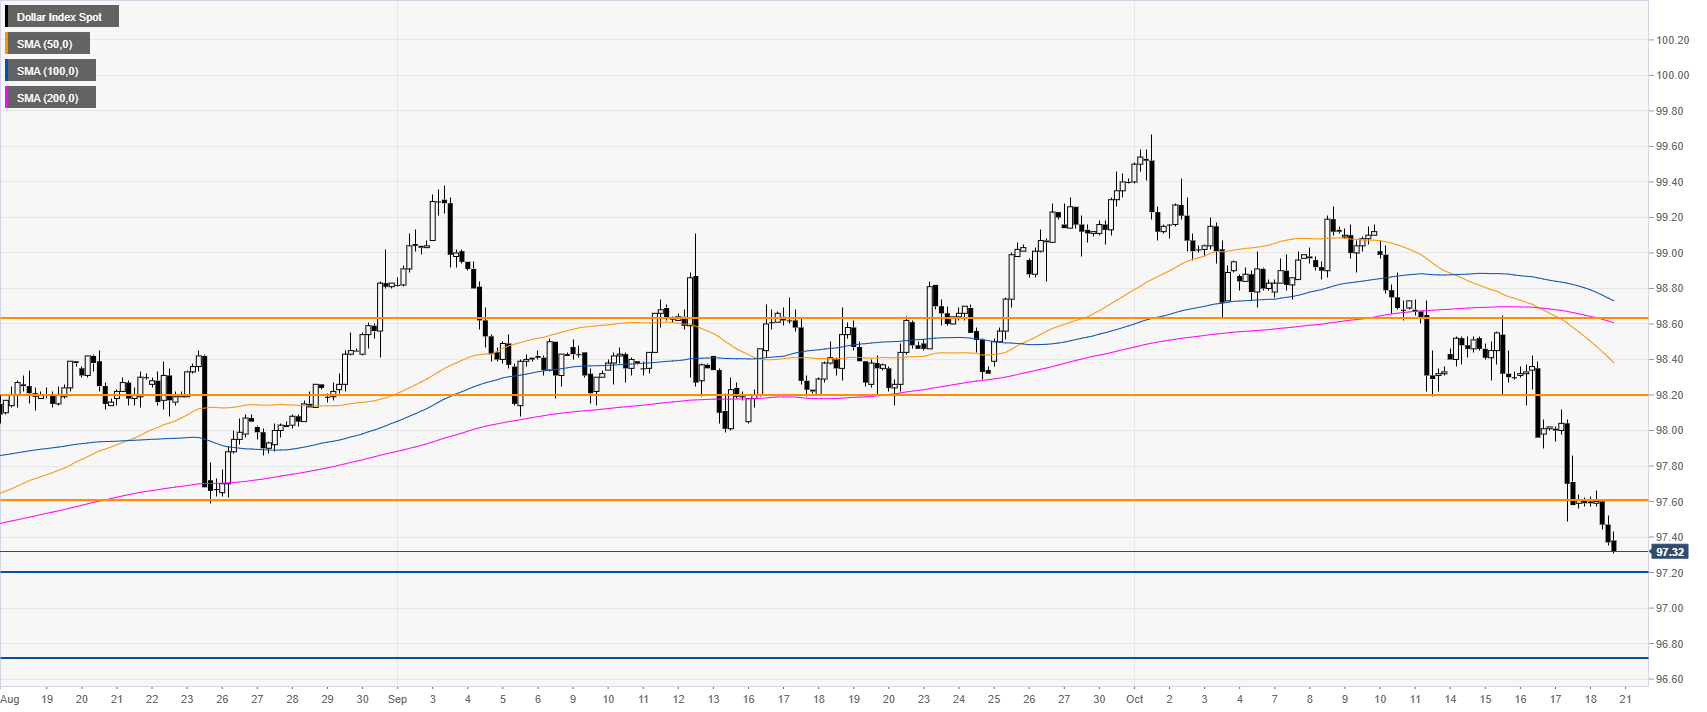
DXY four-hour chart
DXY is under heavy bearish pressure below its main SMAs as the market broke below the 97.60 support level. Given the strong bearish momentum, it can be expected that the market can drop to the 97.20 level. Further down lies the 96.70 support.
Additional key levels
