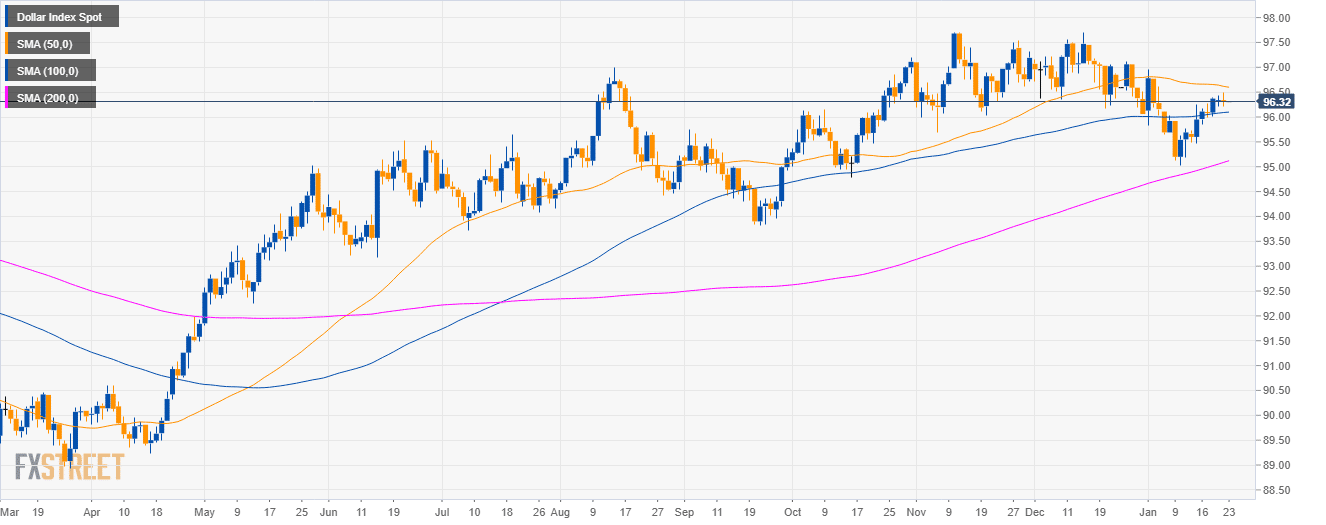
DXY daily chart
- DXY is trading in a bull trend above the 100 and 200-day simple moving average (SMA).
- As forecast, DXY bulls reached the 96.50 level but were unable to continue their rally above that level.
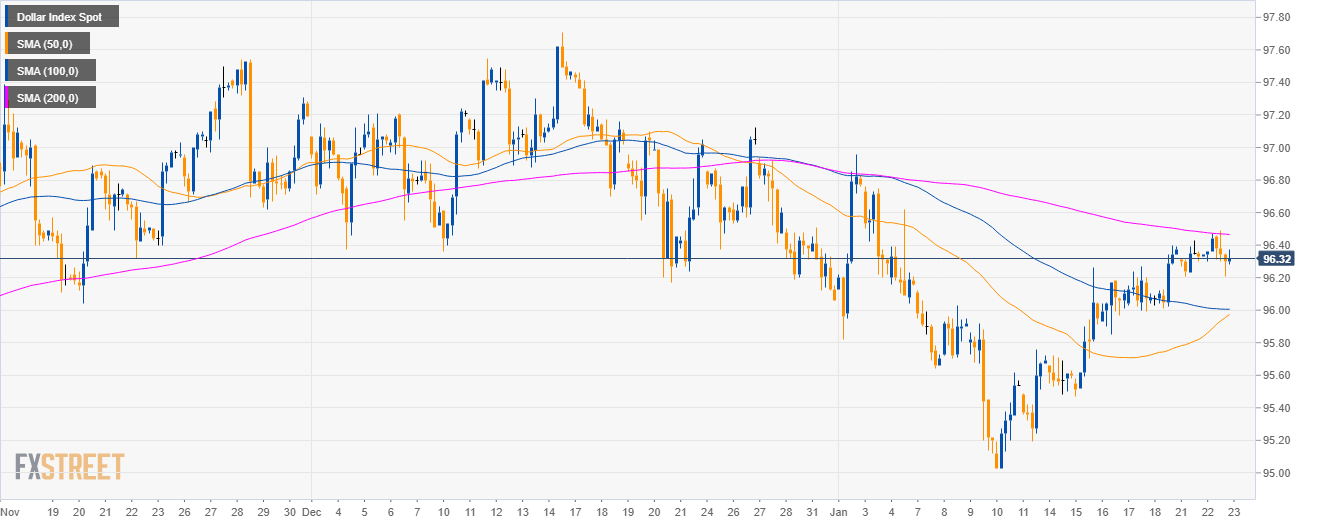
DXY 4-hour chart
- DXY bulls have broken above the 50 and 100 SMA but they need to jump above the 200 SMA.
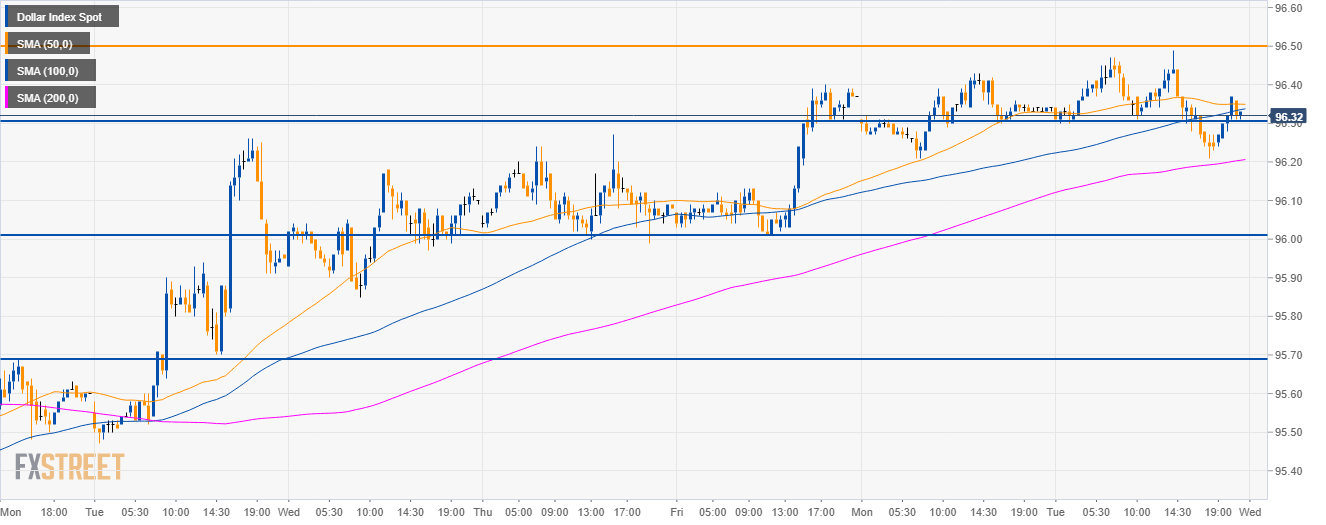
DXY 30-minute chart
- Now that the 96.50 level has been tested, bears are likely to take control and drive the market to 96.00 the figure.
Additional key levels
Dollar Index Spot
Overview:
Today Last Price: 96.32
Today Daily change: -0.02 pips
Today Daily change %: -0.02%
Today Daily Open: 96.34
Trends:
Daily SMA20: 96.15
Daily SMA50: 96.64
Daily SMA100: 96.08
Daily SMA200: 95.05
Levels:
Previous Daily High: 96.43
Previous Daily Low: 96.21
Previous Weekly High: 96.4
Previous Weekly Low: 95.47
Previous Monthly High: 97.71
Previous Monthly Low: 96.06
Daily Fibonacci 38.2%: 96.35
Daily Fibonacci 61.8%: 96.29
Daily Pivot Point S1: 96.22
Daily Pivot Point S2: 96.11
Daily Pivot Point S3: 96
Daily Pivot Point R1: 96.44
Daily Pivot Point R2: 96.55
Daily Pivot Point R3: 96.66
