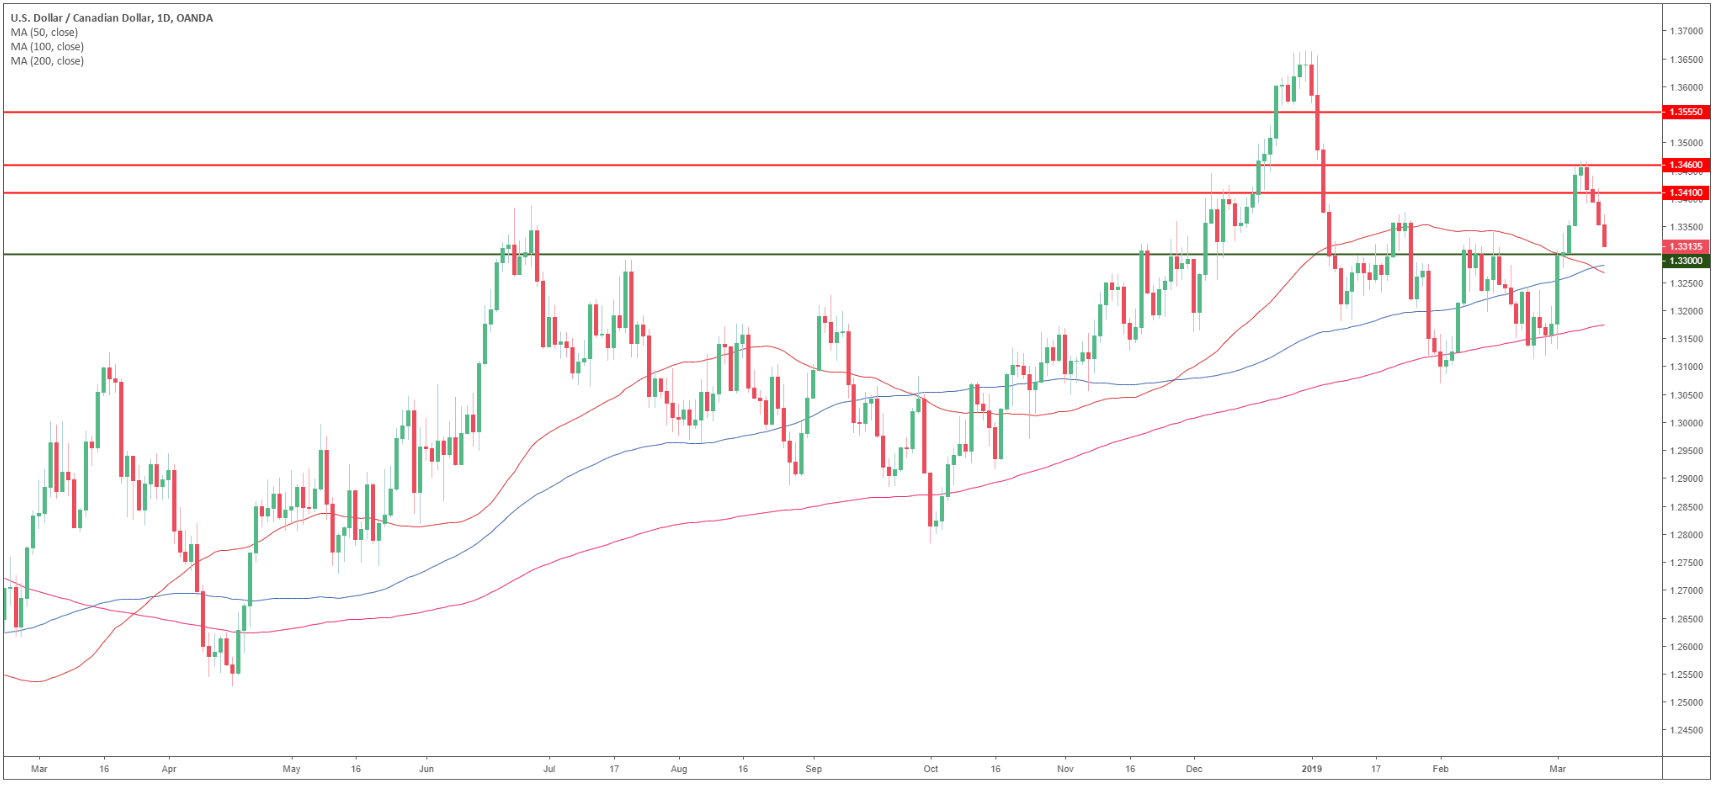
USD/CAD daily chart
- USD/CAD is trading in a bull trend above its main simple moving averages (SMAs).
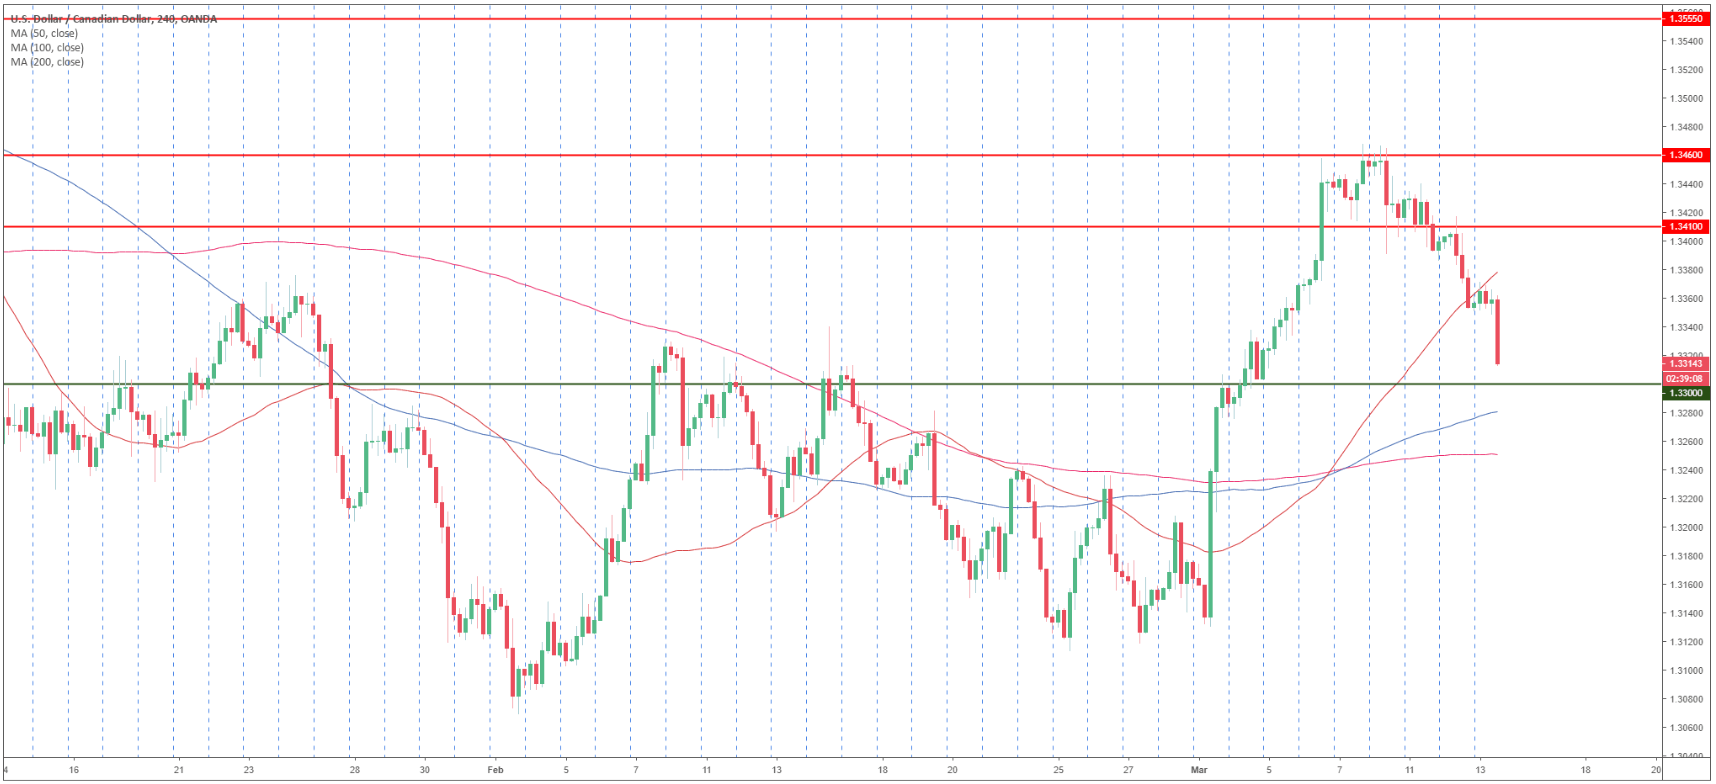
USD/CAD 4-hour chart
- USD/CAD is trading between the 50 and 100 SMAs suggesting a consolidation in the medium-term.
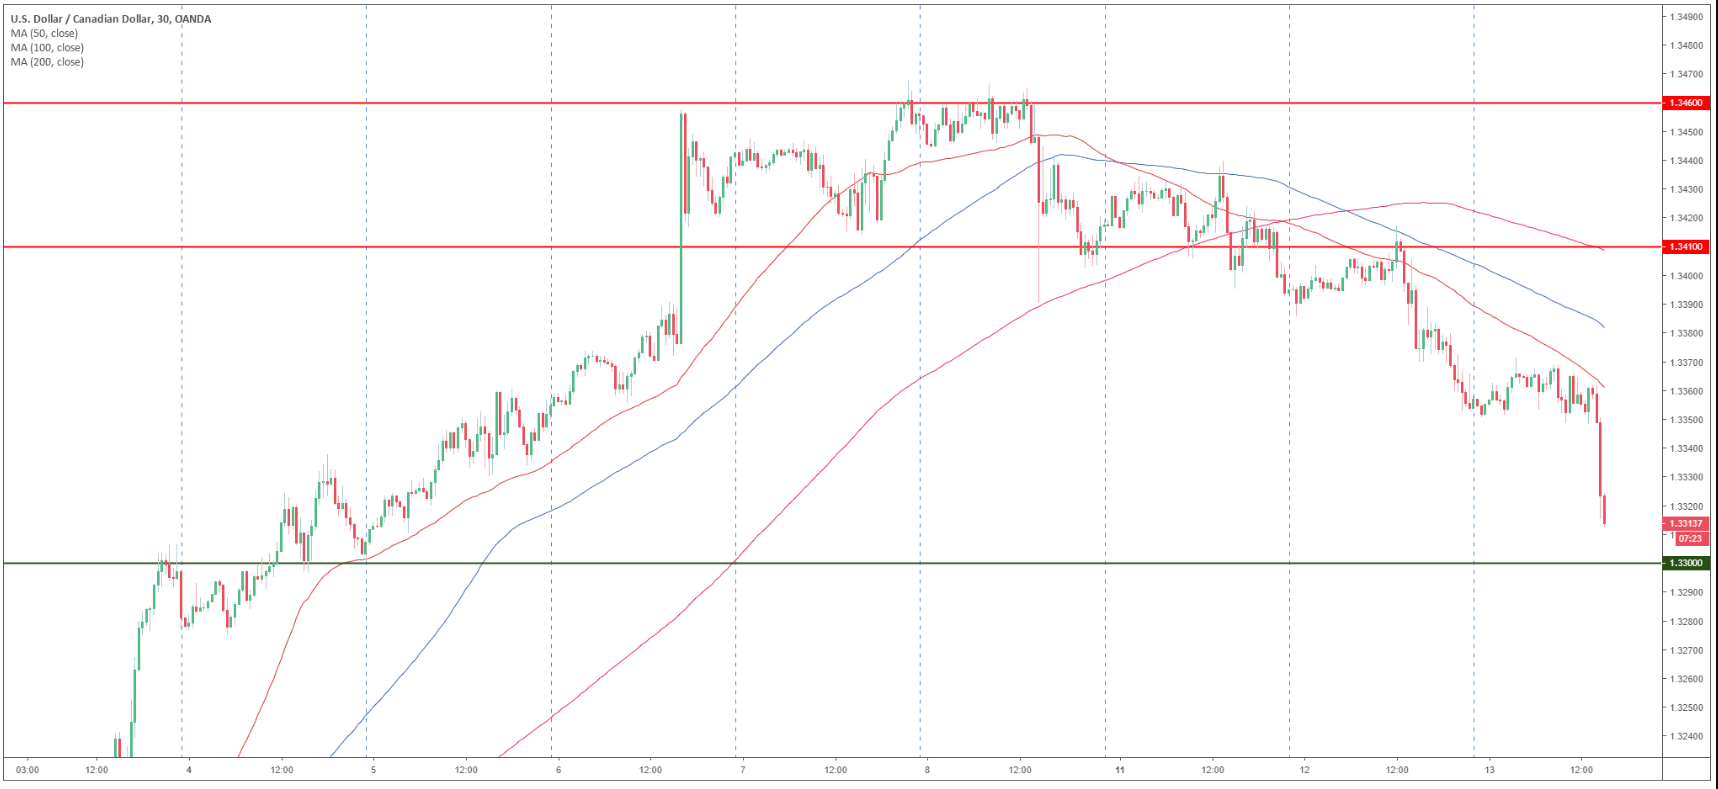
USD/CAD 30-minute chart
- USD/CAD is trading below its main SMAs suggesting bearish momentum in the short-term.
- The break below 1.3410 is leading to 1.3300 figure.
- Key resistances are at 1.3410 and 1.3460 level.
Additional key levels
USD/CAD
Overview:
Today Last Price: 1.3318
Today Daily change: -35 pips
Today Daily change %: -0.26%
Today Daily Open: 1.3353
Trends:
Daily SMA20: 1.3273
Daily SMA50: 1.3272
Daily SMA100: 1.3295
Daily SMA200: 1.3181
Levels:
Previous Daily High: 1.3418
Previous Daily Low: 1.3352
Previous Weekly High: 1.3469
Previous Weekly Low: 1.3275
Previous Monthly High: 1.3341
Previous Monthly Low: 1.3069
Daily Fibonacci 38.2%: 1.3377
Daily Fibonacci 61.8%: 1.3393
Daily Pivot Point S1: 1.333
Daily Pivot Point S2: 1.3307
Daily Pivot Point S3: 1.3263
Daily Pivot Point R1: 1.3397
Daily Pivot Point R2: 1.3441
Daily Pivot Point R3: 1.3464
