- USD/CAD tumbles to mid-1.2300 and lowers on the day.
- Crude oil prices remain near multi-year highs, giving room to Cad.
- US yields fell after the US CPI data was released that further weighed on the USD/CAD.
Throughout the Asian session, the USD/CAD outlook remained weak, last hovering around its lowest level since July 6, just above mid-1.2300.
-If you are interested in social trading apps, check our detailed guide-
Fundamental outlook: Oil and US yields to guide
Over the next several months, crude oil prices will likely remain near multi-year highs because of an increased likelihood of a supply crunch. In turn, the commodity-pegged Canadian dollar strengthened, which was seen as the key factor dragging USD/CAD price movements amid sluggish US dollar sentiment.
As investors remained uncertain about a prolonged period of inflation in spite of the somewhat stronger US CPI report on Wednesday, the US dollar retreated from its 13-month high. In addition, a sharp decline in yields on long-term US Treasury bonds led to a further fall in the US dollar.
A future tightening of Fed policy has also been fully factored in by the markets. This has discouraged traders from setting new bullish bets for the safe-haven dollar in combination with the risk sentiment. The USD/CAD pair was impacted by this as well.
The market is shifting focus to monthly US retail sales data later in the North American session. US bond yields will also affect the dollar and give the USD/CAD pair some momentum. Finally, oil price dynamics will guide short-term traders on a few opportunities in the future.
-If you are interested in brokers with Nasdaq, check our detailed guide-
USD/CAD technical outlook: More losses to come
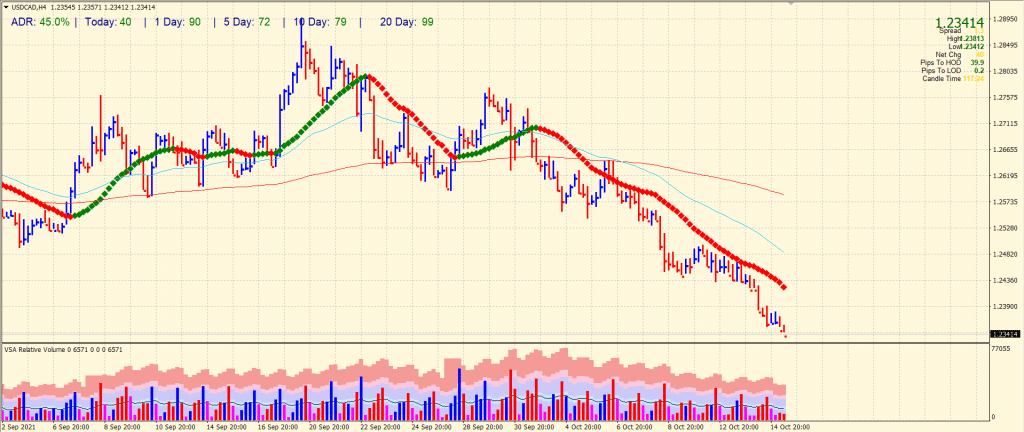
The USD/CAD price remains depressed at around 1.2350. The pair seems too feeble for any upside correction as the price is lying well below the key SMAs on the 4-hor chart. The volume data shows huge bearish potential, pointing more losses towards the 1.2300 handle. If the pair doesn’t hold, it may slide further towards the 1.2240 horizontal level. On the upside, the bullish attempts may be capped by the 1.2400 handle ahead of 1.2420 (20-period SMA) and then 1.2485 (50-period SMA).
Looking to trade forex now? Invest at eToro!
67% of retail investor accounts lose money when trading CFDs with this provider. You should consider whether you can afford to take the high risk of losing your money.
