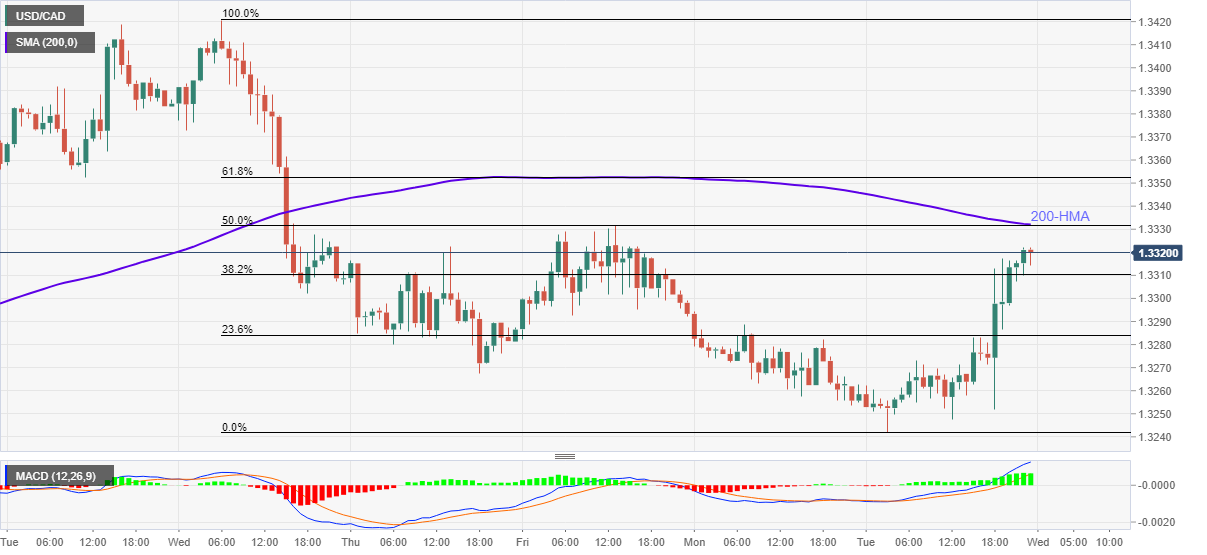
- USD/CAD fades upside momentum beyond 1.3300, near the highest since last Friday.
- Confluence of 200-HMA, 50% Fibonacci retracement challenges bullish MACD signals.
- Sellers may watch over late-Monday tops during further downside.
USD/CAD drops to 1.3316 during the early Asian session on Wednesday. In doing so, the pair fizzles the previous day’s run-up to the three-day high.
Even if MACD signals further upside, USD/CAD bulls will remain cautious unless breaking a joint of 200-HMA and 50% Fibonacci retracement of the quote’s fall from September 30 to October 06, around 1.3330-35.
On the contrary, sellers may also await a clear downside break of the 1.300 theshold for fresh entries.
Following that 1.3280 and the monthly bottom surrounding 1.3240 will gain the USD/CAD bears’ attention.
Meanwhile, the 61.8% Fibonacci retracement level of 1.3352 offers an additional upside barrier to the pair buyers if at all they manage to cross 1.3335.
USD/CAD hourly chart
Trend: Pullback expected
