- USD/CAD snaps four-day losing streak.
- The bears cheer sustained trading below monthly resistance line, 21-day SMA.
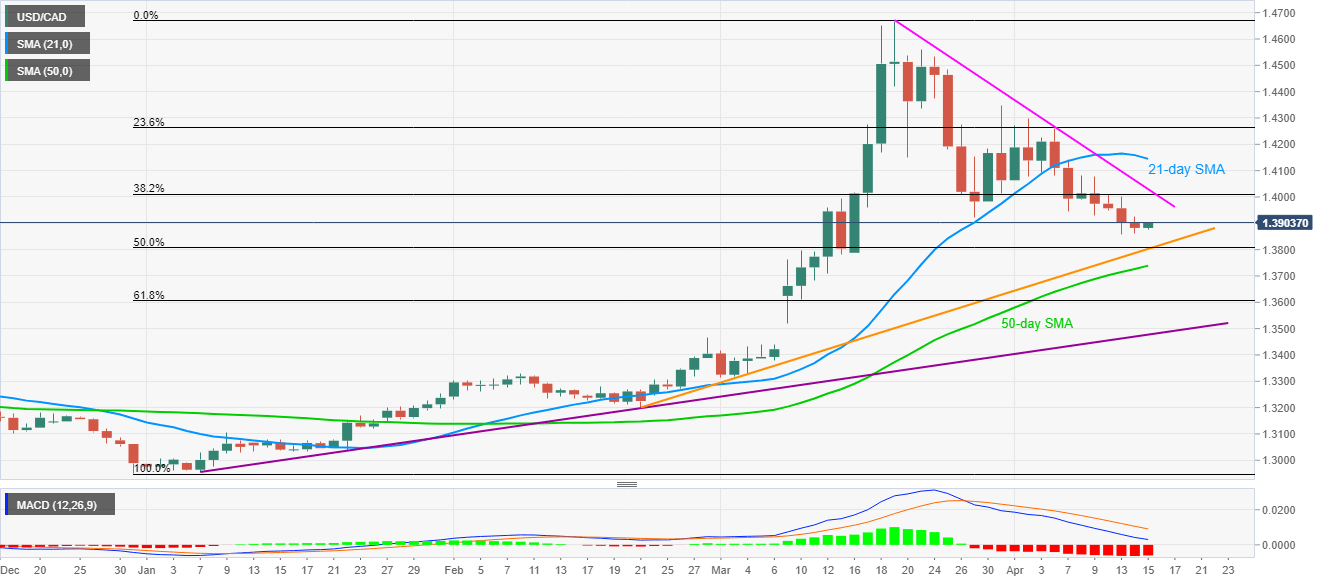
- A confluence of a seven-week-old rising trend line, 50% Fibonacci retracement restrict immediate downside.
Even if USD/CAD snaps the four-day losing streak to probe 1.3900, the Loonie pair remains below a month-old resistance line and 21-day SMA amid early Wednesday.
As a result, the pair’s latest pullback fails to defy its gradual downward trajectory towards a two-month-old rising trend line and 50% Fibonacci retracement of December 31, 2019, to March 19, 2020, around 1.3810/05.
Should sellers concentrate more on the bearish MACD below 1.3805, also break 1.3800 round-figure, 50-day SMA level of 1.3740 will lure them.
Alternatively, the aforementioned resistance line, at 1.4030, and the 21-day SMA level of 1.4145 guards the pair’s upside attempts.
USD/CAD daily chart
Trend: Bearish
