- USD/CAD holds onto the previous day’s recovery gains from 1.3990.
- A confluence of 21-day SMA, resistance-line of short-term falling wedge become the key.
- The bullish formation’s support, 61.8% Fibonacci retracement can limit near-term downside.
USD/CAD registers 0.12% gains to 1.4030 while heading into the European session on Thursday. In doing so, the pair escalates the previous day’s recovery moves towards the key upside barrier comprising the upper line of a bullish technical pattern and 21-day SMA.
Ahead of the 1.4160/65 resistance confluence, 38.2% Fibonacci retracement level of February-March upside, around 1.4100, can check the buyers.
Though, an upside break of 1.4165 on the daily chart will confirm the bullish formation and propel the quote to the previous month’s top surrounding 1.4670. However, 23.6% Fibonacci retracement near 1.4320 can offer an intermediate halt during the rise.
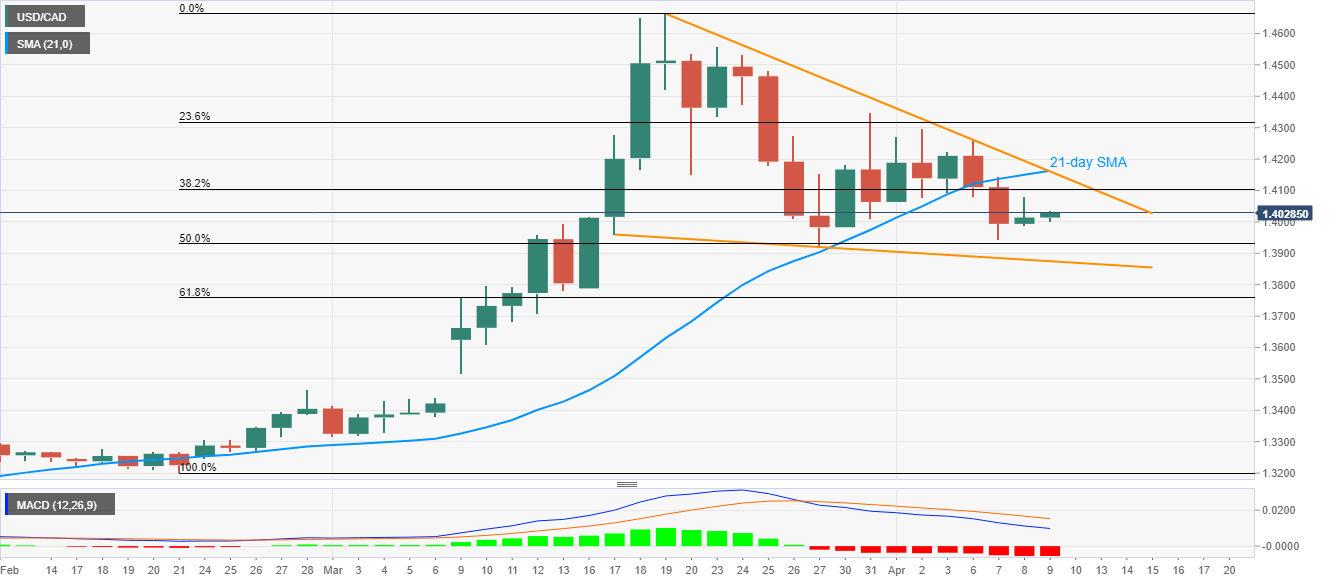
On the flip side, 50% of Fibonacci retracement, close to 1.3930, can act as the immediate support ahead of the lower line of the said pattern near 1.3875.
While the pair’s break below 1.3875 defies the bullish formation, 61.8% Fibonacci retracement near 1.3750 may challenge the sellers.
USD/CAD daily chart
Trend: Further recovery expected
