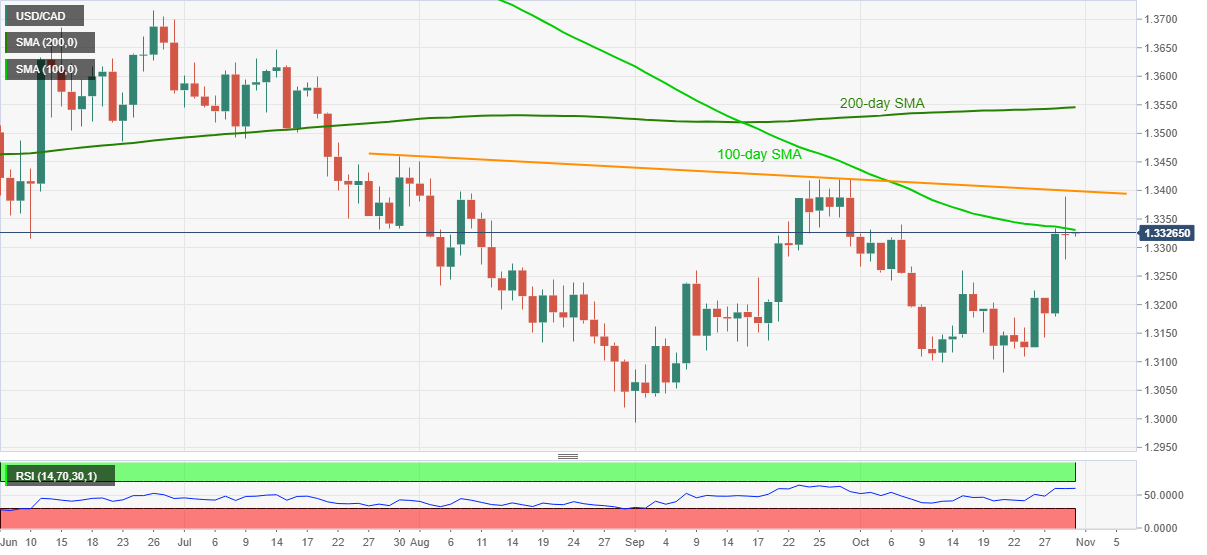
- USD/CAD retraces from the monthly high of 1.3389, marked on Thursday.
- Failures to cross the key resistance line, SMA can recall the mid-October top.
- 200-day SMA offers an extra filter to the north-run.
USD/CAD consolidates from the fresh high of the month, flashed the previous day, while easing to 1.3321 during the pre-Tokyo open Asian trading on Friday.
Despite registering the fresh high of the month yesterday, USD/CAD failed to provide a daily close beyond a falling trend line from July 30 as well as the 100-day SMA.
As a result, a pullback in the USD/CAD prices towards October 15 top near 1.3260 can be expected. Though, the 1.3200 round-figure and 1.3180 can challenge the quote’s further downside ahead of directing the bears to the 1.3081 level portraying the month’s low.
Meanwhile, a clear break above the 100-day SMA level of 1.3330 can mark another attempt to cross the multi-day-old resistance line, at 1.3400 now.
In that case, the July-end top of 1.3459 and 1.3545 mark including 200-day SMA will be on the USD/CAD buyers’ radar.
USD/CAD daily chart
Trend: Pullback expected
