- USD/CAD extends recovery moves from 1.3386, but stays below 200-day SMA.
- Bullish candlestick formation, coupled with oversold RSI, keeps buyers hopeful.
- March month low may entertain sellers during the fresh downside below recent lows.
USD/CAD keeps the previous day’s pullback from three-month low while taking the bids near 1.3420 amid the initial Asian session on Wednesday. The Loonie pair printed an inverted hammer candle on the daily chart on Tuesday. The trend reversal suggesting candlestick formation joins oversold RSI conditions to suggest the pair’s further recovery.
As a result, the 200-day SMA level of 1.3465 becomes the immediate upside target for the buyers to watch. However, the pair’s further advances depend upon how well it crosses March 09 low of 1.3517.
Should the quote manage to provide a daily closing beyond 1.3517, late-May bottom around 1.3730 might lure the buyers.
Alternatively, the pair’s downside below the weekly low of 1.3357 will negate the hopes for the bulls. In doing so, the USD/CAD prices may drop to March month low 1.3315.
In a case where the bears dominate past-1.3315, February month bottom surrounding 1.3200 could return to the charts.
USD/CAD daily chart
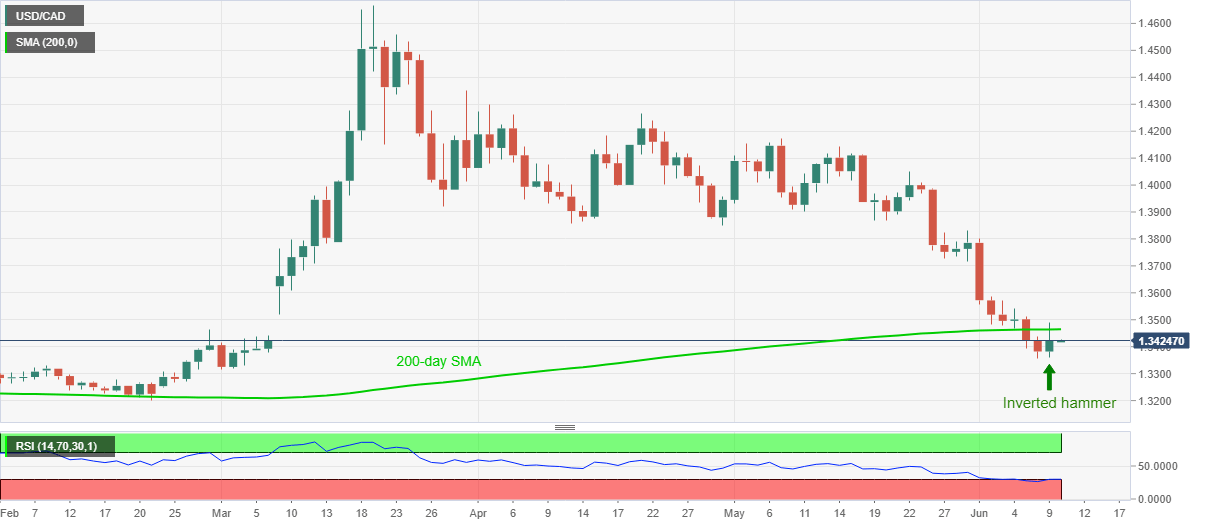
Trend: Further recovery expected
