- USD/CAD stays depressed near one-week low after multiple failures to cross 100-day EMA.
- The monthly ascending trend line adds to the support.
- 61.8% Fibonacci retracement, July-end top offer extra resistance.
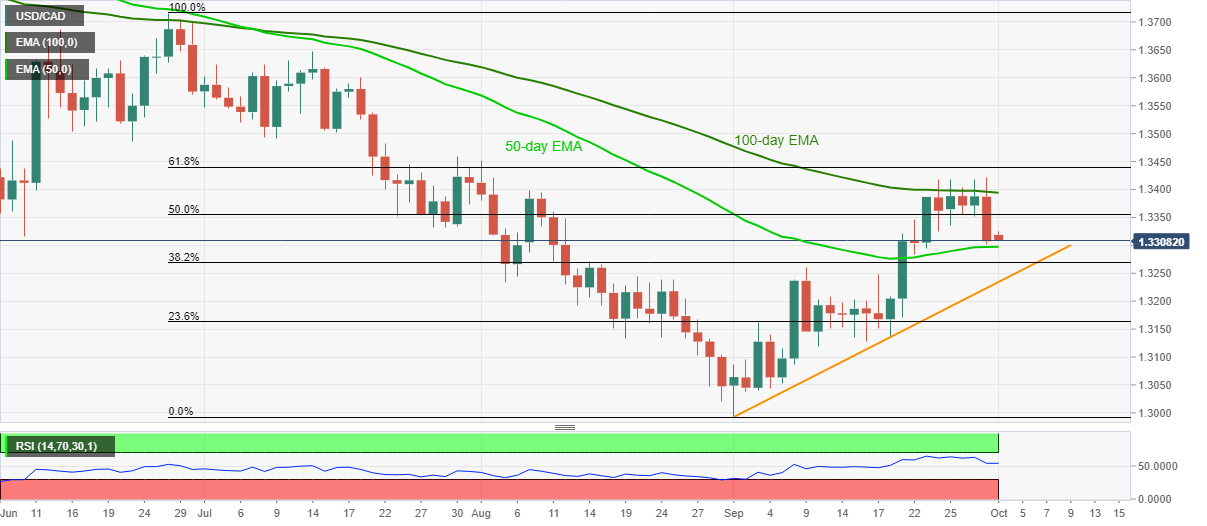
USD/CAD drops to 1.3307 during the initial hours of Thursday’s Asian session. The loonie pair marked the heaviest losses in three weeks the previous day after taking a U-turn from 100-day EMA for the fifth time in the last one week.
While RSI consolidation, coupled with the multiple failures to clear the key EMA, favor sellers, 50-day EMA, at 1.3297 now, can restrict the pair’s immediate downside.
Should the sellers dominate below 50-day EMA, September 09 high around 1.3260 and an ascending trend line from the month-start, currently around 1.3230 can probe the USD/CAD bears afterward.
Meanwhile, the 50% Fibonacci retracement of June-September downside, close to 1.3355, becomes immediate resistance to watch during the pair’s fresh upside.
Though, buyers are less likely to be convinced unless witnessing a daily closing beyond the 100-day EMA level of 1.3394.
Following that, 61.8% of the mentioned Fibonacci retracement and July 30 peak, respectively near 1.3440 and 1.3460, will lure the USD/CAD bulls.
USD/CAD daily chart
Trend: Further weakness expected
