- USD/CAD bears catch a breath around 50% Fibonacci retracement level.
- A confluence of 100-day EMA, 61.8% Fibonacci retracement offers strong downside support.
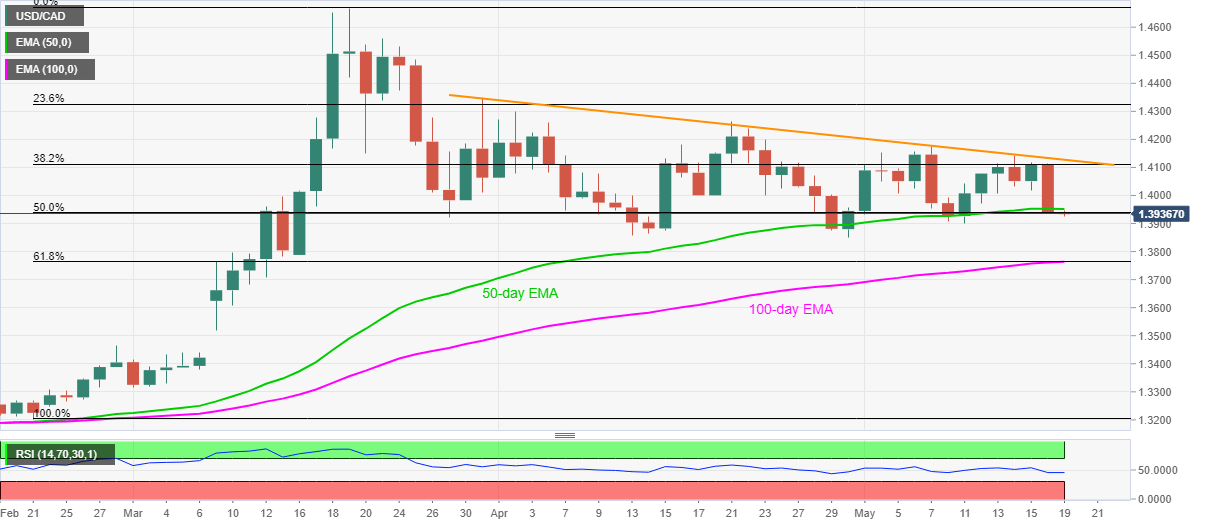
- A seven-week-old falling trend line caps the pair’s near-term upside.
USD/CAD takes rounds to 1.3940/35 amid the early Tuesday’s trading session. The pair dropped to the lowest since May 11 the previous day but sees to extend the fall below 50-day EMA. It’s worth mentioning that 50% Fibonacci retracement of the quote’s late-February to March month upside seems to limit the pair’s further downside.
Considering the pair’s sustained trading below 50-day EMA, sellers will look for a sustained break below 50% Fibonacci retracement level of 1.3935 to extend the recent fall towards April 30 low of 1.3850.
Though, 100-day EMA and 61.8% Fibonacci retracement around 1.3765/60 will check the bears during further downside.
Alternatively, a clear break above the 50-day EMA level of 1.3952 will have to cross a falling trend line from March 31, currently near 1.4130, to recall the bulls.
USD/CAD daily chart
Trend: Further downside expected
