- USD/CAD stays on the back foot near the lowest in two weeks.
- MACD flirts with the bears after the break of 21-day SMA, monthly support line.
- Sellers can aim for the mid-September lows on the downside break of 50-day SMA.
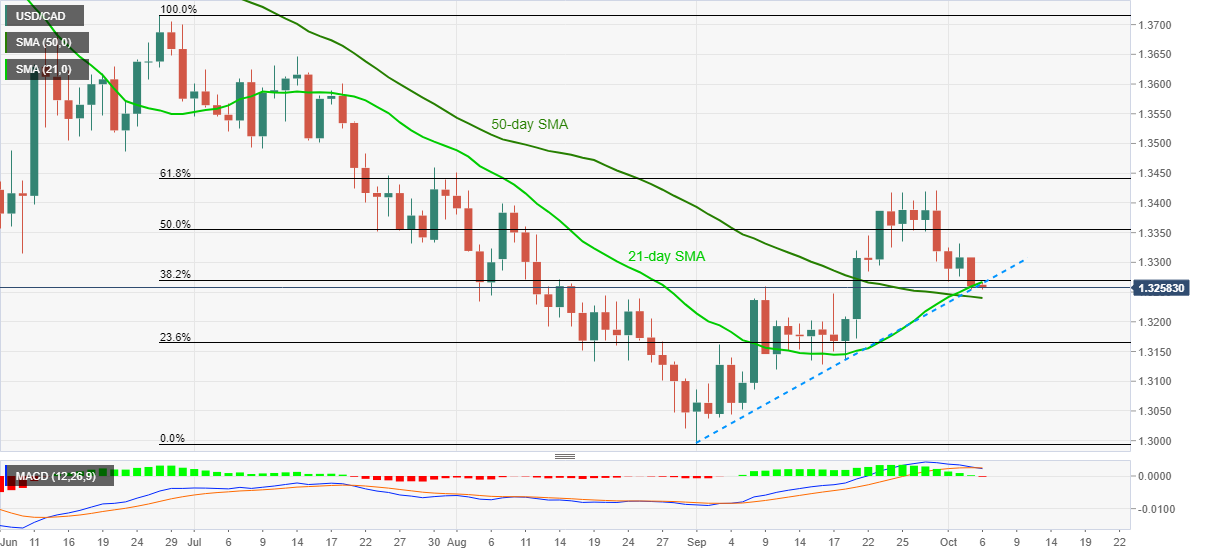
USD/CAD drops to 1.3257 during the initial Asian session on Tuesday. In doing so, the sellers are catching a breather around the lowest since September 21 after breaking a confluence of 21-day SMA and an ascending trend line from September 01. The MACD is also turning bearish after almost a month.
Though, the 50-day SMA level of 1.3239 becomes the key support for the USD/CAD traders to watch ahead of targeting the September 16 low near 1.3130. During the declines, the quote may rest on the 1.3200 round-figure.
In a case where the bears keep the reins past-1.3130, the 1.3100 threshold and the previous month’s low near 1.2995 will be in the spotlight.
On the contrary, the pair’s ability to bounce back beyond the 1.3266 previous support confluence, now resistance, will enable it to regain 1.3300 psychological magnet.
Should there be a further run-up beyond 1.3300, the USD/CAD bulls may aim for a 50% Fibonacci retracement of June-September downside and the previous month’s top, respectively around 1.3355 and 1.3420.
USD/CAD daily chart
Trend: Pullback expected
