- USD/CAD looks to extend recovery gains above 1.3600.
- Technical set up favors the bulls, a break above 200-HMA eyed.
- Upbeat US NFP report could bolster the bullish momentum.
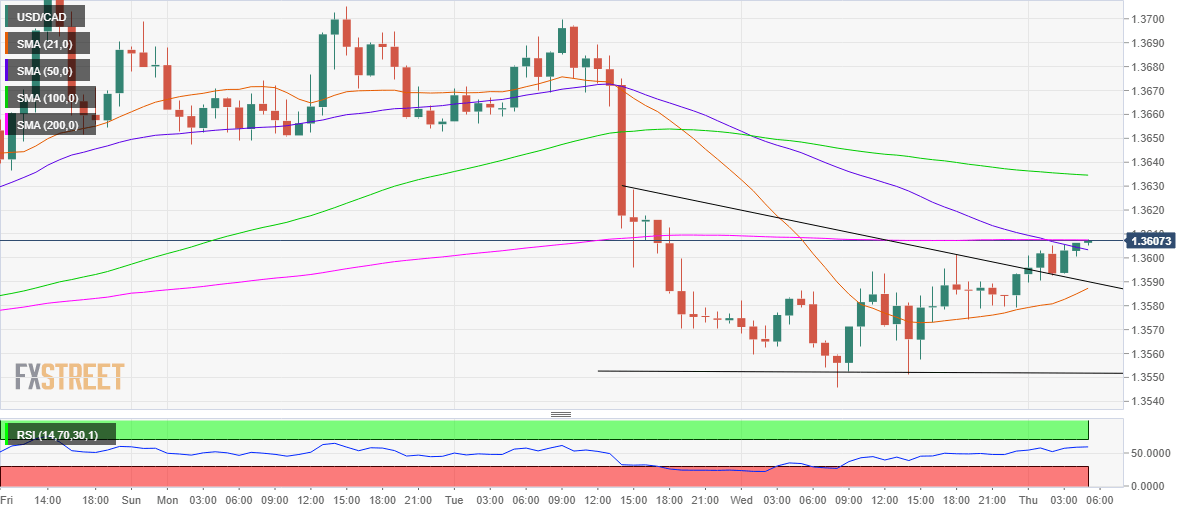
USD/CAD is trying hard to extend its recovery momentum beyond 1.3600, as the horizontal 200-hourly Simple Moving Average (HMA) at 1.3607 appears to be a tough nut to crack for the bulls.
As observed on the hourly chart, the spot has confirmed a descending triangle bullish breakout in early Asia, following an hourly close above the 1.3595.
With bulls in form, the CAD pair also took out the next 50-HMA resistance at 1.3604. The further upside will now gain momentum only on a break above the aforesaid key hurdle of 200-HMA.
A failure to break through the latter could see the price retracing towards the falling trendline resistance-turned-support at 1.3590, where the upward sloping 21-HMA also lies.
The bullish bias will remain in place for the major so long as it holds above the 21-HMA. The hourly Relative Strength Index (RSI) trades flat but above the midline, suggesting that the upside bias still remains intact heading into the critical US Non-Farm Payrolls (NFP) data release.
USD/CAD hourly chart
USD/CAD additional levels
