- USD/CAD trims early day gains towards revisiting the 100, 200-HMA confluence.
- Sustained trading above key Fibonacci retracements, MACD conditions favor recovery moves.
- Weekly resistance line holds the key to welcome buyers.
USD/CAD fades bounce off weekly lows while easing to 1.2630 during Wednesday’s Asian session. In doing so, the quote fizzles the early Asia recovery moves but stays above the key HMA confluence as the MACD teases bulls.
Even if the HMA confluence around 1.2620 fails to stop the latest selling pressure, 50% and 61.8% Fibonacci retracement levels of the USD/CAD upside during late last week, respectively around 1.2600 and 1.2570, will be challenging the bears.
In a case where USD/CAD sellers dominate past-1.2570, odds of its drop to the multi-month low marked last week, near 1.2470 can’t be ruled out.
Meanwhile, buyers will look for a clear break of a downward sloping trend line from Monday, currently, around 1.2680, to recall the bullish bets.
Following that, the latest swing high around 1.2740 and the previous month’s peak surrounding 1.2870 should return to the charts
USD/CAD hourly chart
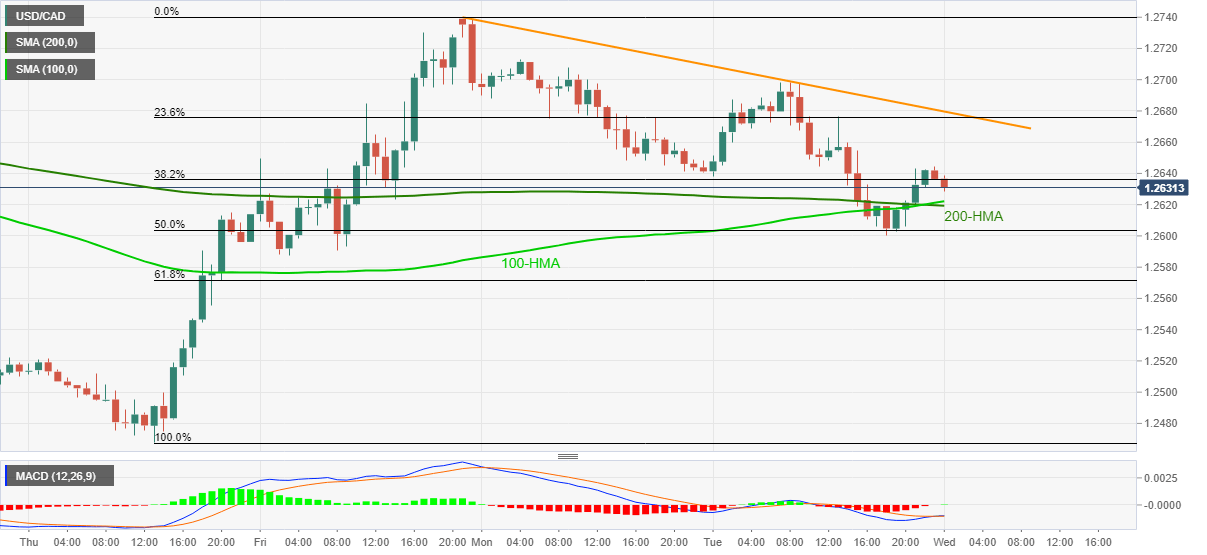
Trend: Further recovery expected
