- USD/CAD buyers keep the baton amid bullish MACD, price-positive chart patterns.
- 200-day SMA adds to the support.
USD/CAD fails to extend the previous day’s declines while taking a U-turn from 61.8% Fibonacci retracement of its May-December 2019 declines. That said, the pair currently trades 0.10% positive near 1.3350 during early Tuesday.
In addition to the sustained trading above the key Fibonacci, bullish MACD also favors the pair’s further run-up towards September 2019 top close to 1.3385.
Though, June 18, 2019 high near 1.3430 and the resistance line of an ascending trend channel establishes since the start of the year, at 1.3450 now, can question the buyers afterward.
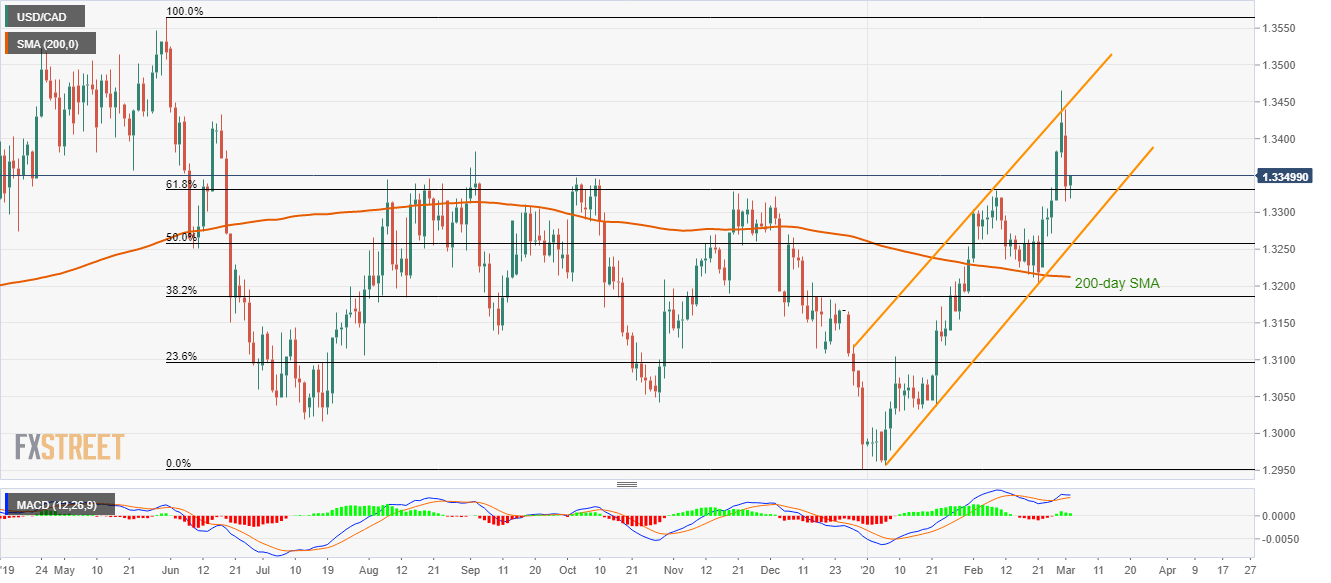
Alternatively, pair’s declines below 61.8% Fibonacci retracement level of 1.3330 need to defy a confluence of 50% Fibonacci and the said channel’s support, close to 1.3255/60, to visit 200-day SMA level of 1.3212.
If at all the bears manage to dominate past-1.3212, 38.2% of Fibonacci retracement and early-January high, respectively near 1.3185 and 1.3100, will flash on their radar.
USD/CAD daily chart
Trend: Bullish
