- USD/CAD keeps recovery moves from the lowest since June 10.
- Bullish candlestick formation, nearly oversold RSI conditions favor buyers.
- Bears will have to wait for a downside break below 1.3300.
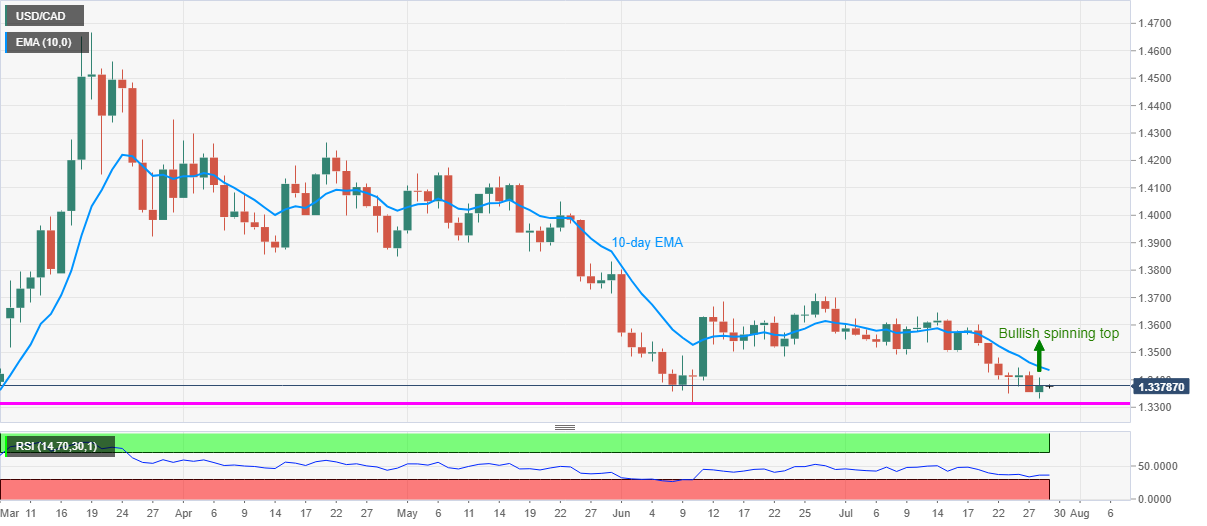
USD/CAD wavers around 1.3380 during the early Wednesday’s Asian session. The loonie pair printed a bullish candlestick formation while bouncing off the seven-week low the previous day. However, 10-day EMA restricts the quote’s immediate upside.
Considering the RSI conditions, backed by the upbeat candlestick, the quote is expected to stretch the recent recovery moves beyond a 10-day EMA level of 1.3435 towards June 23 low of 1.3485.
Though, pair’s further upside depends upon its capacity to cross 1.3500 round-figures, which in turn will open the gate for the monthly high surrounding 1.3645/50.
Meanwhile, a daily closing below 1.3330 will again attack June month’s bottom close to 1.3315. However, any more downside will need a daily closing past-1.3300 round-figure.
Should that happen, February month low near 1.3200 will lure the bears ahead of diverting them to 1.3000 psychological magnet.
USD/CAD daily chart
Trend: Pullback expected
