- USD/CAD extends bounce off six-week-old horizontal support.
- Upbeat RSI conditions pushes bulls towards 200-bar SMA.
- February’s multi-month low will lure the bears below the key support.
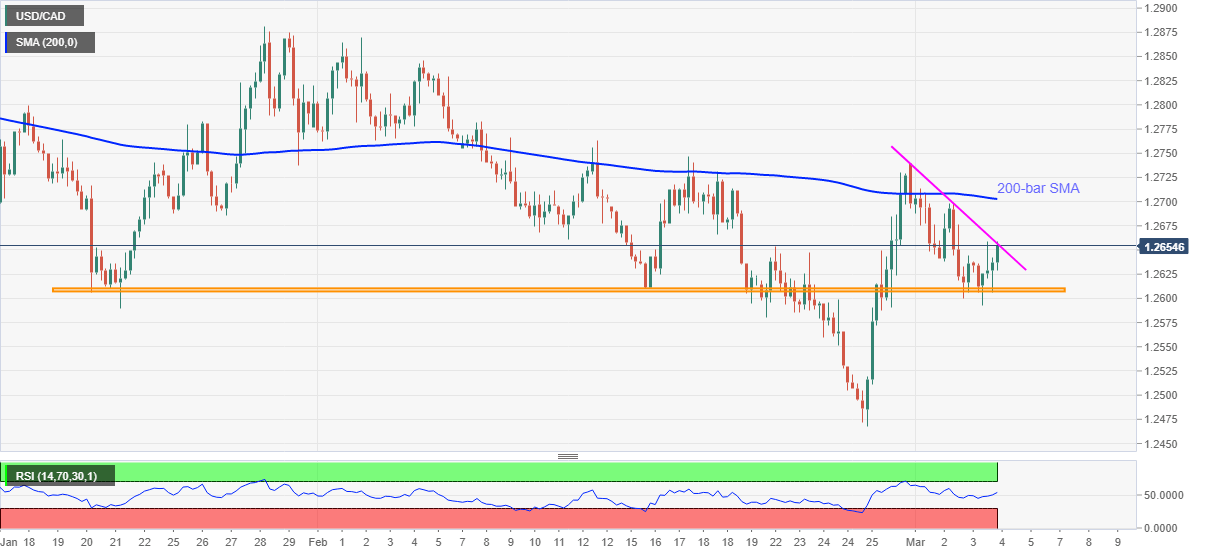
USD/CAD picks up bids around 1.2657, up 0.10% intraday, during Thursday’s Asian session. In doing so, the quote battles a downward sloping trend line from Monday while stretching bounce off a horizontal support area established since January 21.
Given the absence of overbought RSI conditions, coupled with the sustained recovery from key support, USD/CAD is up for extending the latest run-up beyond the immediate 1.2660 hurdle.
Following that, the USD/CAD bulls will again try to cross the 200-bar SMA, at 1.2702 now, while eyeing the 1.2760-65 resistance area.
Alternatively, a pullback from the current levels needs to provide a decisive break below the stated support-zone near 1.2610-2600 to recall the USD/CAD sellers.
It should, however, be noted that the quote’s weakness past-1.2600 will not hesitate to challenge the multi-month low marked in February, around 1.2470.
USD/CAD four-hour chart
Trend: Further upside expected
