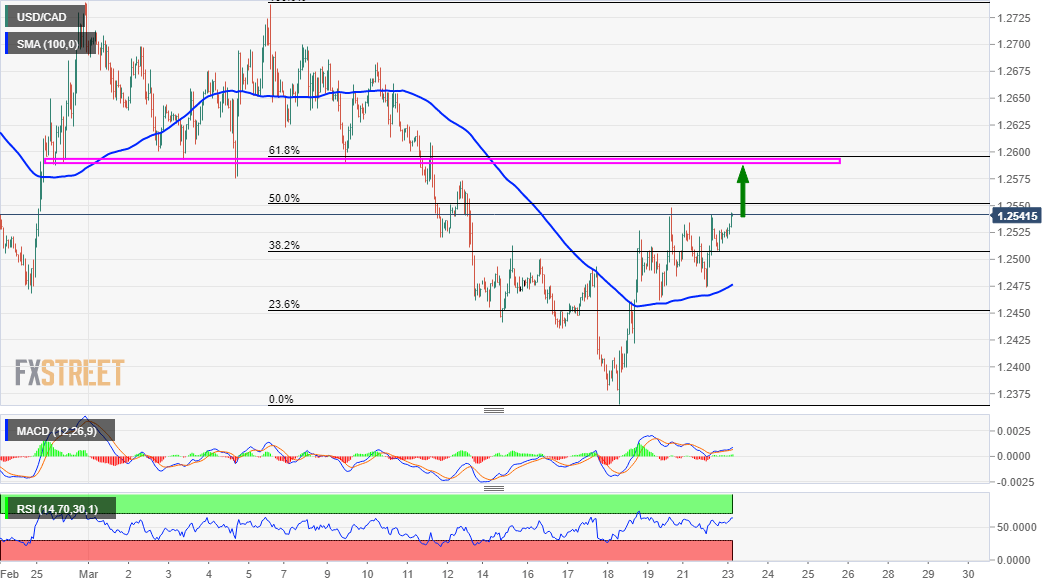
- USD/CAD regained positive traction on Tuesday and moved back closer to the 1.2550 hurdle.
- Mixed technical indicators on hourly/daily charts warrant caution for aggressive bullish traders.
- The 100-hour SMA now becomes a strong base and should help limit any meaningful downside.
The USD/CAD pair built on the previous day’s solid rebound from the vicinity of 100-hour SMA and gained some follow-through traction through the Asian session on Tuesday. The momentum pushed the pair back closer to mid-1.2500s, or a resistance marked by the 50% Fibonacci level of the 1.2740-1.2365 recent slide to the lowest level since February 2018.
The US dollar was back in demand following the overnight optimistic comments by Fed Chair Jerome Powell and US Treasury Secretary Janet Yellen, reaffirming the upbeat US economic outlook. Apart from this, a softer tone around crude oil prices undermined the commodity-linked loonie and remained supportive of the USD/CAD pair’s intraday positive move.
Meanwhile, technical indicators on hourly charts have been gaining positive traction and support prospects for additional intraday gains. That said, oscillators on the daily chart – though have been recovering from the negative territory – are yet to confirm the bullish outlook and warrant some caution before positioning for any further appreciating move.
Hence, any subsequent strength is more likely to confront stiff resistance near previous strong support, around the 1.2575 region. The mentioned are coincides with the 61.8% Fibo. level and should now act as a key pivotal point. A sustained move beyond will mark a fresh bullish breakout and pave the way for an extension of the ongoing recovery from multi-year lows.
On the flip side, the 38.2% Fibo. level, around the 1.2515-10 region now seems to protect the immediate downside ahead of the key 1.2500 psychological mark. This is closely followed by 100-hour SMA, around the 1.2480 region and the 23.6% Fibo. level, near mid-1.2400s, which if broken will negate any near-term positive bias and prompt some technical selling.
The USD/CAD pair might then turn vulnerable and accelerate the fall back to the 1.2400 round-figure mark. The downward trajectory could further get extended and allow bears to challenge multi-year lows support, around the 1.2365 region touched last week.
USD/CAD 1-hourly chart
Technical levels to watch
