- USD/CAD snaps four-day losing streak.
- Recovery to gain momentum above 50-HMA.
- Bulls to retain control ahead of US CPI data.
USD/CAD rises four the first time in five days this Tuesday, benefiting from the US dollar rebound and rally in WTI prices.
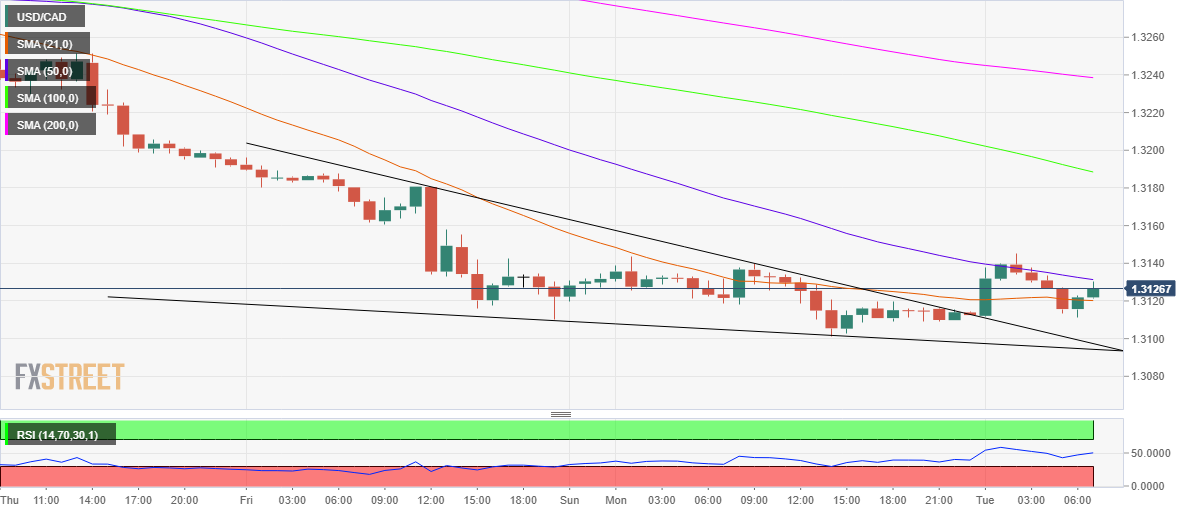
The spot’s rebound following Monday’s bearish consolidation carved out a falling wedge pattern on the hourly chart, with a breakout confirmed on an hourly close above the falling trendline resistance at 1.3111.
However, the bulls face rejection at the downward-sloping 50-hourly moving average (HMA), now at 1.3131, on the road to recovery. A sustained move above the latter could call for a test of the psychological 1.3150 level.
Buyers would then target the 100-HMA at 1.3188. The hourly Relative Strength Index (RSI) stands at 51.45, having pierced through the midline. This suggests that the upside appears more compelling.
On the flip side, the 1.3100 area is the level to beat for the bears should the horizontal 21-HMA support at 1.3120 give way.
USD/CAD: Hourly chart
USD/CAD: Additional levels
