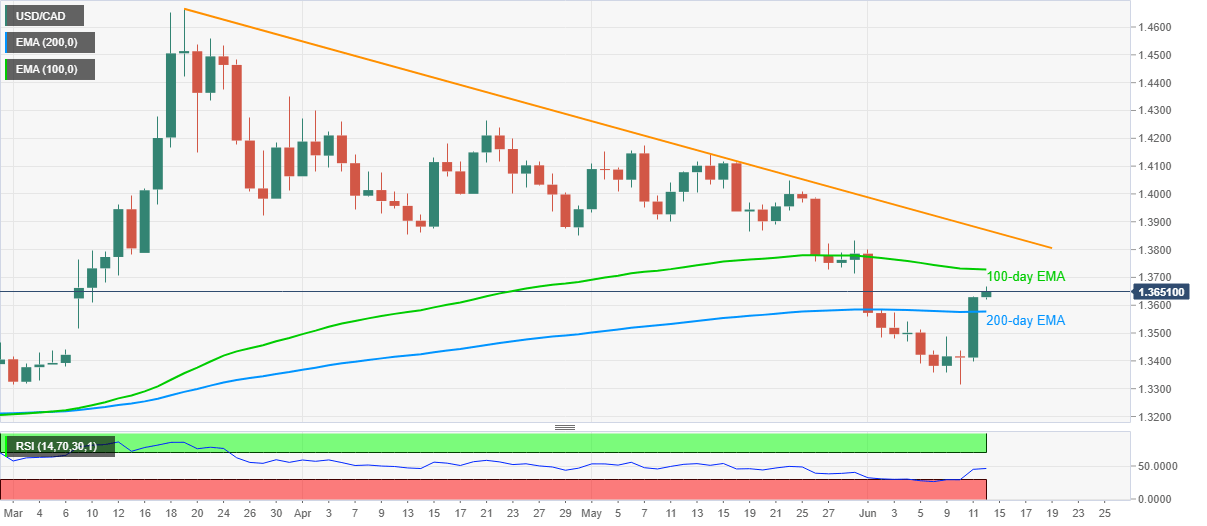
- USD/CAD extends Wednesday’s pullback to probe the highest levels since June 01.
- Normal RSI conditions join a sustained break of key EMA to favor the buyers.
- 100-day EMA, the three-month-old falling trend line on the bulls’ radars.
Despite recently stepping back from 1.3667, the nine-day high, USD/CAD prints 0.13% gains while taking rounds to 1.3650 during Friday’s Asian session. The quote’s ability to successfully break 100-day EMA gains support from RSI conditions to keep the bulls hopeful.
As a result, the pairs’ further run-up towards a 100-day EMA level around 1.3730 could be anticipated. However, a falling trend line from March 19, at 1.3870, might challenge the quote additional north-run.
It should be noted that the monthly high around 1.3800 could work as a buffer between 1.3730 and 1.3870.
Meanwhile, the pair’s daily closing below 100-day EMA level of 1.3575 might avail 1.3430 as an intermediate halt before revisiting the monthly bottom close to 1.3315.
If at all the bears refrain from respecting 1.3315 rest-points, February month’s low near 1.3200 could return to the charts.
USD/CAD daily chart
Trend: Bullish
