- USD/CAD keeps the 25-pip range between 1.3295 and 1.3320 while probing the August 12 high.
- Buyers rely on the confirmation of a bullish chart pattern, 50-day SMA also strengthens the neckline support.
USD/CAD seesaws around 1.3310 amid the initial Asian trading on Tuesday. The loonie major confirmed a bullish chart pattern the previous day while rising to the highest in over 1.5 months.
Considering the absence of the overbought RSI conditions and sustained trading beyond the neckline of stated inverse head-and-shoulders, bulls are likely to keep reins.
As a result, August month’s top near 1.3400 becomes the immediate resistance on optimists’ radar whereas the July 30 peak around 1.3460 can challenge the buyers afterward.
If at all USD/CAD remains positive beyond 1.3460, the late-June bottom surrounding 1.3485 can offer an intermediate halt during the rise to the 1.3500 threshold.
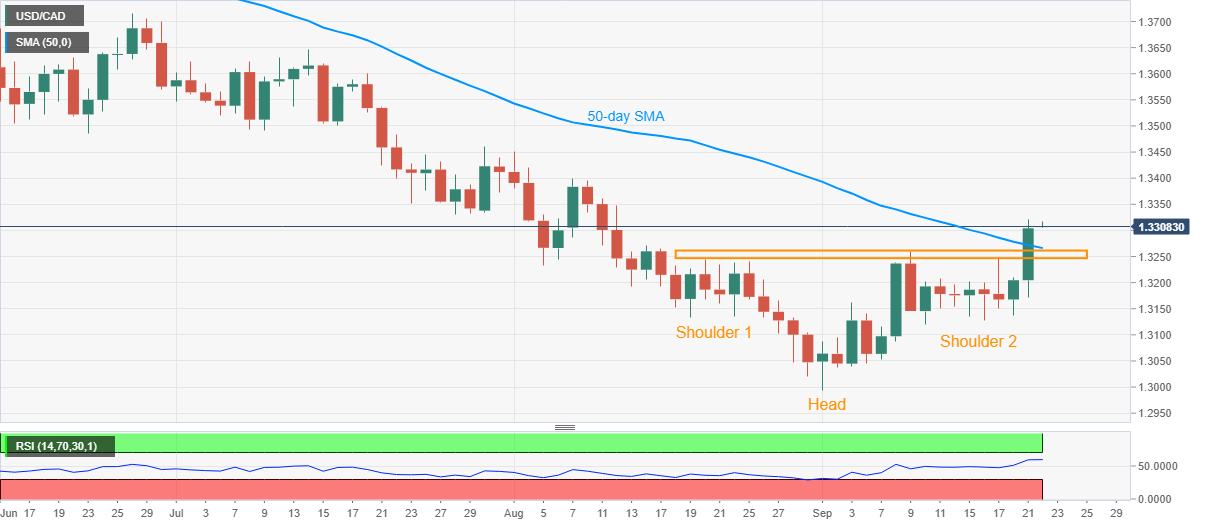
Alternatively, the pair’s 50-day SMA adds strength to the 1.3265/45 neckline area that becomes the key support for sellers to watch.
Should USD/CAD prices drop below 1.3245 on a daily closing, the mid-September bottom close to 1.3130/25 will be in the spotlight.
USD/CAD daily chart
Trend: Bullish
