- Slightly overbought RSI on the 1-hourly chart capped intraday positive move for USD/CAD.
- The set-up favours bulls and supports prospects for a further intraday appreciating move.
- A sustained breakthrough the 1.2650 horizontal support negate the constructive outlook.
The USD/CAD pair stalled its intraday positive move near the 1.2715 area and quickly retreated few pips following the release of upbeat Canadian retail sales data. The mentioned region marks the 61.8% Fibonacci level of this week’s rejection slide from the 1.2800 round-figure mark.
Slightly overbought RSI on the 1-hourly chart seemed to be the only factor that kept a lid on any further gains for the USD/CAD pair. That said, a sustained move beyond 200-hour SMA favours bullish traders and supports prospects for an extension of the recovery from multi-year lows.
The constructive outlook is further reinforced by the fact that oscillators on the 4-hourly chart have just started gaining bullish traction and recovered from the negative territory on the daily chart. Hence, a subsequent positive move back towards challenging a two-month-old descending trend-line resistance, currently around the 1.2765 region, now looks a distinct possibility.
Some follow-through buying has the potential to push the USD/CAD pair further towards the 1.2800 round-figure mark. The momentum could further get extended towards the 1.2835 region, above which bulls are likely to aim to conquer the 1.2900 round-figure mark.
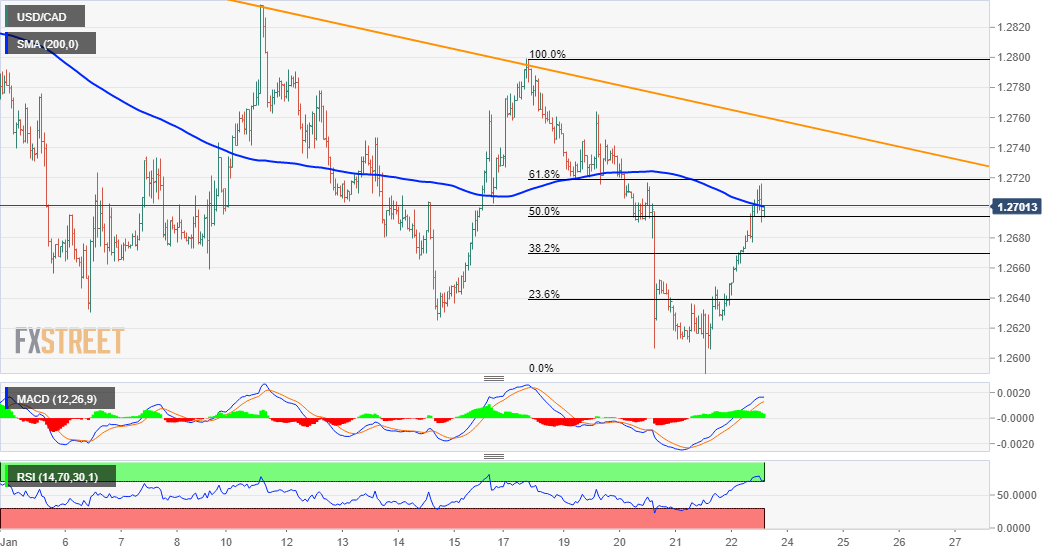
On the flip side, the 38.2% Fibo. level, around the 1.2670 region, now seems to protect the downside. This is closely followed by horizontal support near mid-1.2600s, which if broken decisively will negate prospects for any further recovery and turn the USD/CAD pair vulnerable to slide further.
USD/CAD 1-hourly chart
Technical levels to watch
