- USD/CAD fails to extend the pullback from the key EMA, bounces off 38.2% Fibonacci retracement.
- A monthly rising trend line portrays the short-term recovery.
- 50% Fibonacci retracement, a falling trendline since May 2019 add to the resistance.
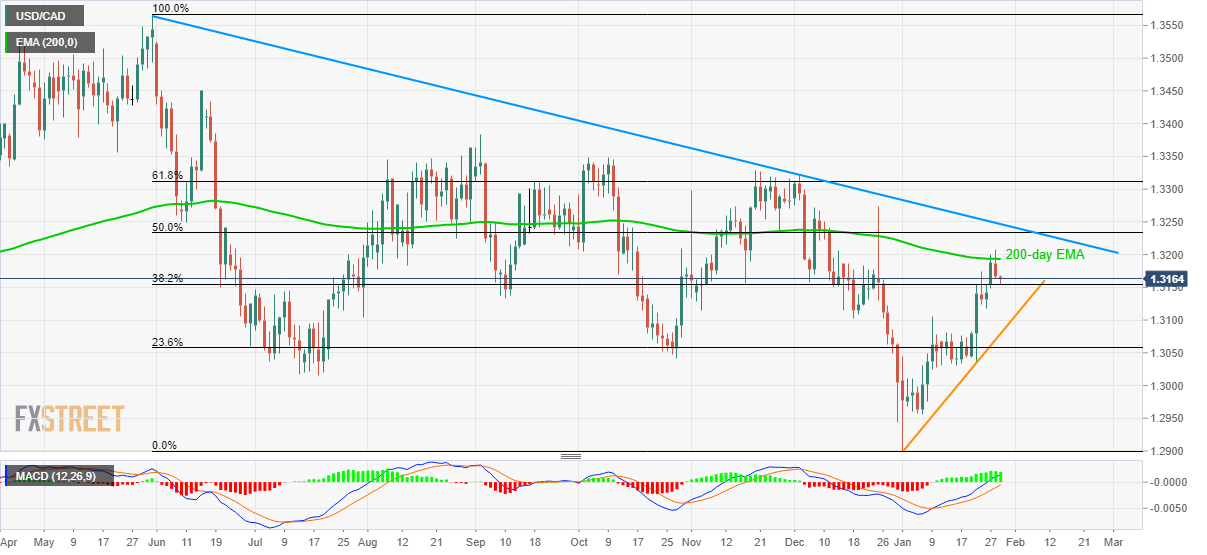
Following its failure to cross 200-day EMA, USD/CAD trades near 1.3165 during early Wednesday. In doing so, the quote bounces off 38.2% Fibonacci retracement of its fall from May 2019 to the current month’s low.
Considering bullish MACD and the recent pullback from 38.2% Fibonacci retracement, prices can again attempt to cross 200-day EMA, at 1.3195 now. Even so, 50% Fibonacci retracement near 1.3235 and a medium-term descending trend line near 1.3250 can keep the bulls chained.
Should there be a clear break of 1.3250, the bulls could aim for November 2019 top surrounding 1.3330.
On the downside, monthly rising trend ascending support line at 1.3080 holds the key to further declines towards 1.3000 and the January 01 low of 1.2900.
USD/CAD daily chart
Trend: Bullish
