- USD/CAD keeps pullback from the key SMA towards short-term horizontal support.
- Tops marked during December 11-16 add to the downside filters, monthly high offers extra challenge to buyers.
USD/CAD stays on the back foot around 1.2850 during Thursday’s Asian session. The pair probed Monday’s top, also the highest since December, the previous day before repeating the pullback moves from 200-bar SMA. However, a horizontal area including multiple levels marked from the early month limit the pair’s downside.
Given the receding strength of the RSI line, coupled with multiple failures to cross 200-bar SMA, the quote is likely to break the 1.2832/25 support-zone. Though, highs marked during December 11, 14 and 16, near 1.2792/89, will question the pair’s further weakness.
In a case where the USD/CAD bears dominate past-1.2789, the monthly bottom of 1.2688 will be the key to watch.
Meanwhile, any pullback from 1.2832 can recall the 1.2900 threshold to the chart. Though, buyers will remain cautious ahead of witnessing an upside break of 200-bar SMA, currently around 1.2930.
Also acting as the upside hurdle is the monthly high of 1.2957 and the 1.3000 round-figure.
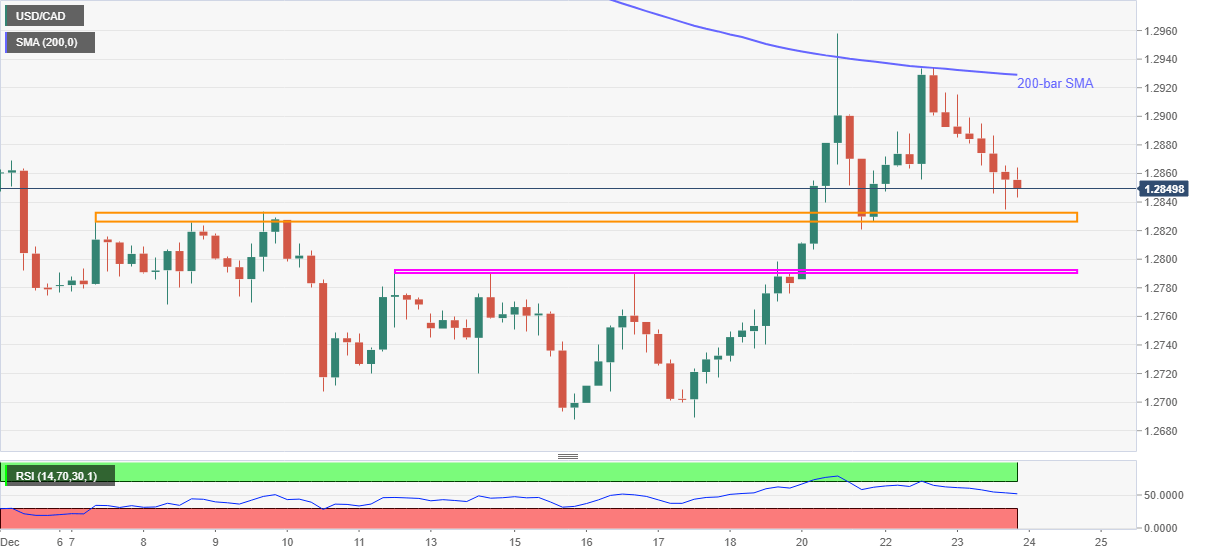
USD/CAD four-hour chart
Trend: Further weakness expected
