- USD/CAD remains weak near the four-week low.
- Oversold RSI conditions can trigger a pullback from the key Fibonacci retracement support.
- 200-bar SMA, 18-day-old falling trend line guard immediate upside.
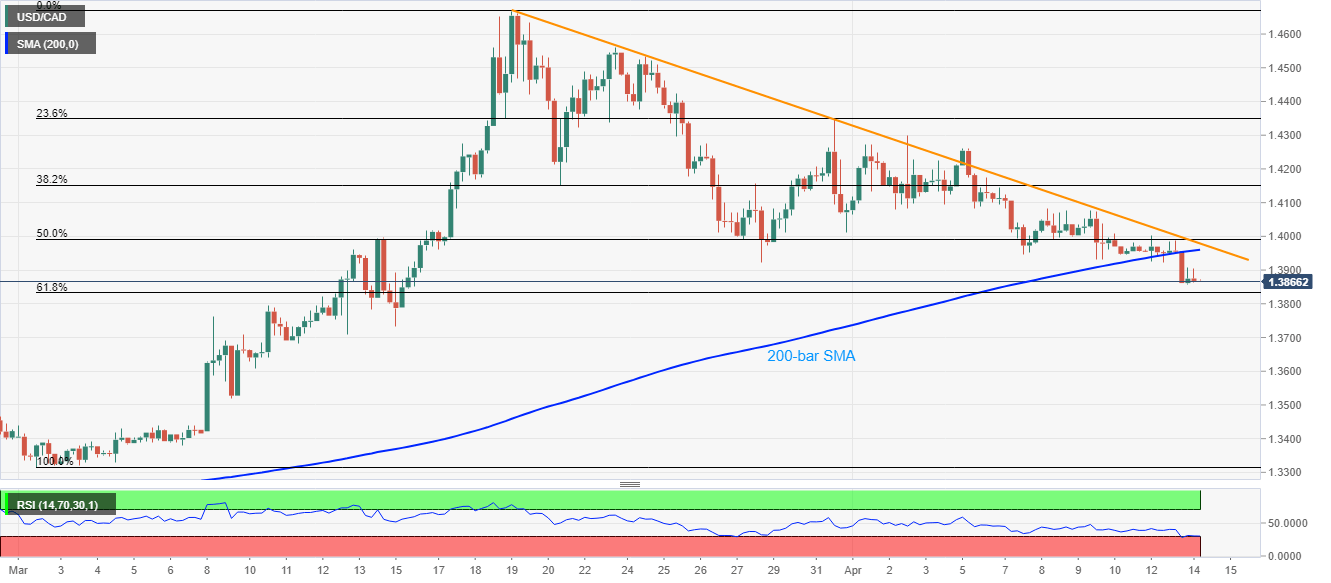
Having slipped below 200-bar SMA, USD/CAD traders near the one-month low while taking rounds to 1.3870 during the pre-European session on Tuesday.
While a sustained break below the key SMA favors the pair’s further declines, oversold RSI conditions point to a pullback from nearby strong support.
As a result, buyers may look for a bounce from 61.8% Fibonacci retracement of March month upside to question the 200-bar SMA level of 1.3960.
However, a downward sloping trend line from March 19, currently at 1.3980, followed by a 50% Fibonacci retracement level of 1.3990 and 1.4000 mark, can restrict the quote’s upside beyond 1.3960.
Alternatively, additional downside past-61.8% Fibonacci retracement level of 1.3830 could revisit mid-March lows near 1.3730 and 1.3700.
USD/CAD four-hour chart
Trend: Pullback expected
