- USD/CAD rebounds from multi-year lows, regains 1.2650.
- The bulls recaptured 21-HMA, with eyes on 50-HMA barrier.
- RSI on hourly chart peeps into the bullish territory.
USD/CAD extends its recovery from the lowest levels since April 2018 reached at 1.2625 on Thursday.
The bulls are rescued by the rebound in the US dollar across the board, as investors resort to the safety bet amid anxiousness over President-elect Joe Biden’s $1.9 trillion stimulus plan, weak US jobs data and resurfacing covid fears.
Further, the 1% drop in WTI prices is also underpinning the recovery in the CAD pair.
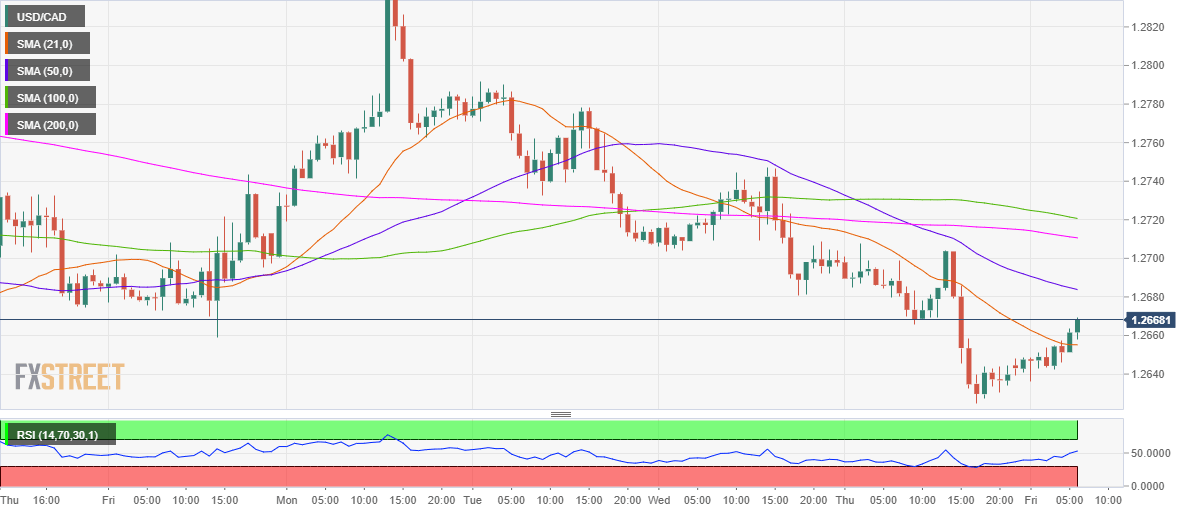
Looking at it technically, the price has recaptured the 21-hourly moving average (HMA) and looks north towards the bearish 50-HMA resistance at 1.2684.
The move higher is backed by the Relative Strength Index (RSI), which has pierced above the midline, currently trading at 52.62.
The next hurdle is seen at 1.2710, which is the horizontal 200-HMA.
The 21-HMA at 1.2660 could limit any pullbacks, below which the psychological 1.2650 support would come into the picture.
The multi-year troughs at 1.2625 would be the final resort for the bulls.
USD/CAD: Hourly chart
USD/CAD: Additional levels
