- USD/CAD eases from 1.3560, still above the key SMA.
- The monthly falling trend line offers immediate upside barrier.
- 1.3440/35 acts as additional support ahead of June 10 bottom.
Despite the latest pullback from 1.3529 to 1.3538, USD/CAD prints 0.10% loss during Wednesday’s Asian session. In doing so, the quote defies Tuesday’s recovery moves from 200-day SMA while still staying below a downward sloping trend line from May 29.
In addition to the latest U-turn from the key SMA, bullish MACD signals also favor the buyers. However, a sustained break above the immediate resistance line, at 1.3585 now, limits nearby moves.
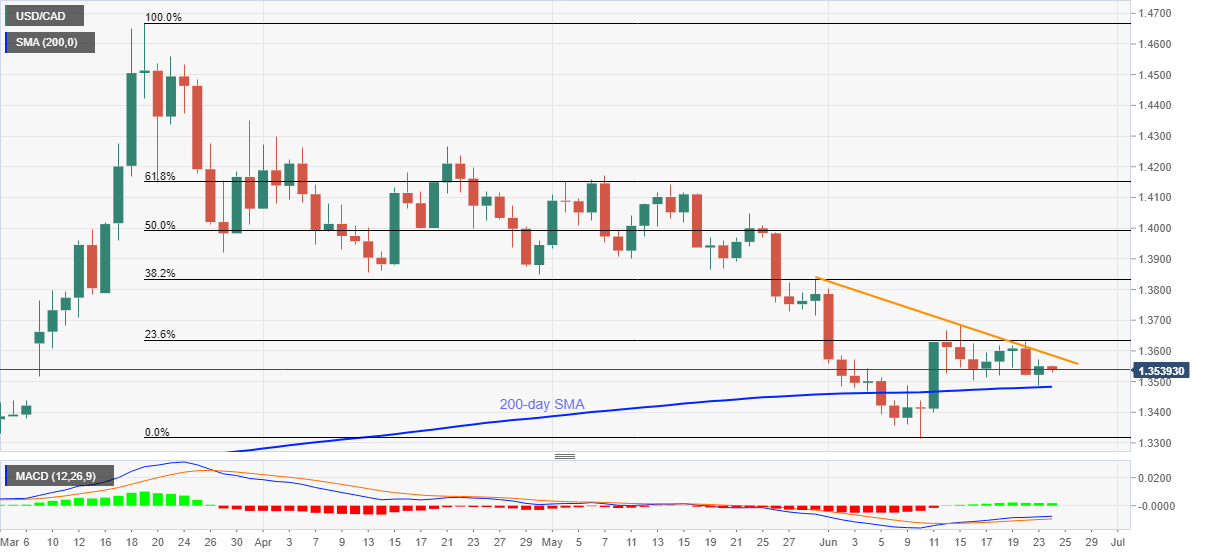
Other than the said trend line resistance, 23.6% Fibonacci retracement of March-June fall and June 15 top, respectively around 1.3635 and 1.3685, also question the optimists.
Alternatively, the pair’s declines below 200-day SMA level of 1.3482 needs to clear the 1.3440/35 support-zone, including highs marked on June 08 and 10, to diver sellers towards the monthly low of 1.3315.
USD/CAD daily chart
Trend: Pullback expected
