- USD/CAD fails to extend the previous day’s recoveries from the monthly low.
- A confluence of 21-day EMA and 38.2% Fibonacci retracement add to the upside barrier.
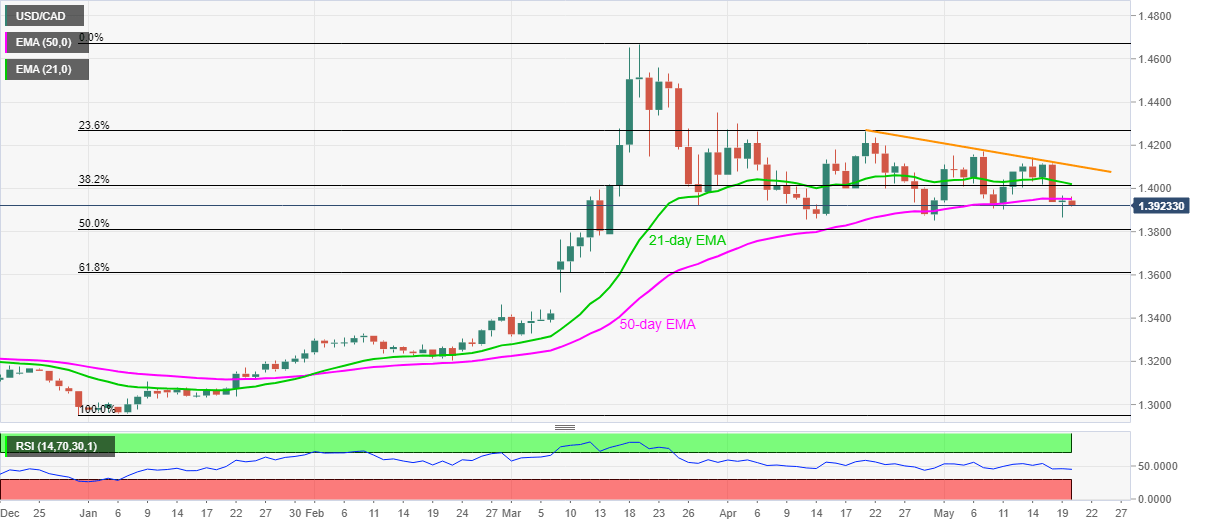
- April month bottom, key Fibonacci retracement levels on the bears’ radar.
USD/CAD drops to 1.3920, down 0.17% on a day, during the early trading hours of Wednesday. The Loonie pair bounced off the monthly low on Tuesday but failed to cross 50-day EMA on a daily closing basis.
As a result, sellers are again targeting 1.3850 support, comprising April month bottom, with 1.3900 and the previous day’s low near 1.3866 acting as intermediate stops.
In a case where the bears keep the reins past-1.3850, 50% and 61.8% Fibonacci retracement levels of the pair’s early-2020 rise, respectively around 1.3810 and 1.3610 can become their favorites.
Meanwhile, an upside clearance of a 50-day EMA level of 1.3950 won’t restore buyers’ confidence as a joint of 21-day EMA and 38.2% Fibonacci retracement near 1.4020 stands tall to check the recoveries.
Even if the pair manages to cross 1.4020, a falling trend line from April 21, at 1.4107 now, can check the bulls.
USD/CAD daily chart
Trend: Bearish
