- USD/CAD extends declines from the monthly top.
- The mid-month tops, the immediate ascending trend line on sellers’ radar.
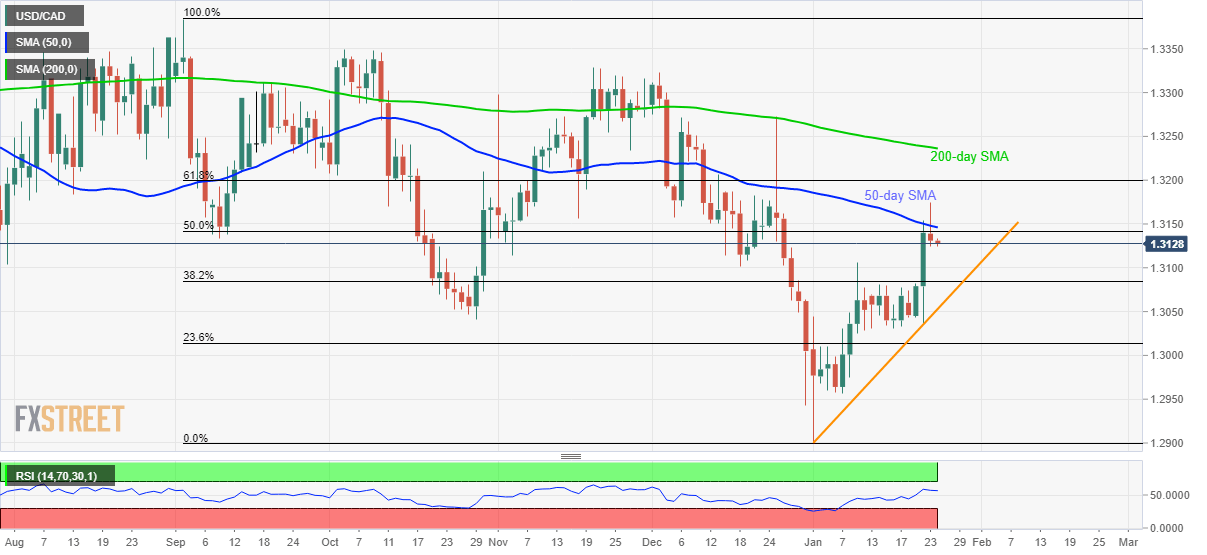
- 50-day SMA, 61.8% Fibonacci retracement hold the key to 200-day SMA.
Following its pullback from the monthly top, USD/CAD drops to sub-1.3130 area during the pre-Europe session on Friday. The pair recently failed to cross 50-day SMA, not to forget 50% Fibonacci retracement level of September 2019 to January 2020 fall.
Sellers now target multiple highs marked during the middle of the month around 1.3080. However, an upward sloping trend line since January 01, at 1.3050, could question further declines.
On the upside, 50% Fibonacci retracement and 50-day SMA will guard the near-term recovery around 1.3140/50, a break of which could escalate the run-up towards 61.8% Fibonacci retracement level of 1.3200.
If at all the bulls manage to keep the sentiment intact beyond 1.3200, a 200-day SMA level of 1.3240 could return to the charts.
USD/CAD daily chart
Trend: Pullback expected
