- USD/CAD fails to keep the bounce off March 04 low.
- A one-week-old falling trend channel keeps the sellers hopeful below key SMAs.
- February monthly low lures the bears during further declines.
- Bulls may not enter trades unless witnessing a break of 200-day SMA.
Following its drop to the lowest since the early-March, USD/CAD takes rounds to 1.3375/80 during the Asian session on Tuesday.
The pair bears cheer a short-term falling trend channel formation below 100 and 200-HMA. However, the support line of the bearish formation seems to offer bounces near the multi-day low.
As a result, the pair’s latest pullback from 1.3360 can aim for 1.3400 and 1.3435/40 during the further recovery.
Though, a confluence of the said channel’s resistance line and 100-HMA, around 1.3465/70, followed by a 200-HMA level of 1.3580, could challenge the bulls afterward.
Alternatively, a downside break below 1.3345 level comprising the channel’s lower line could recall the 1.3300 mark on the chart.
In a case where the bears keep dominating past-1.3300, February month low near 1.3200 will be on their radars.
USD/CAD hourly chart
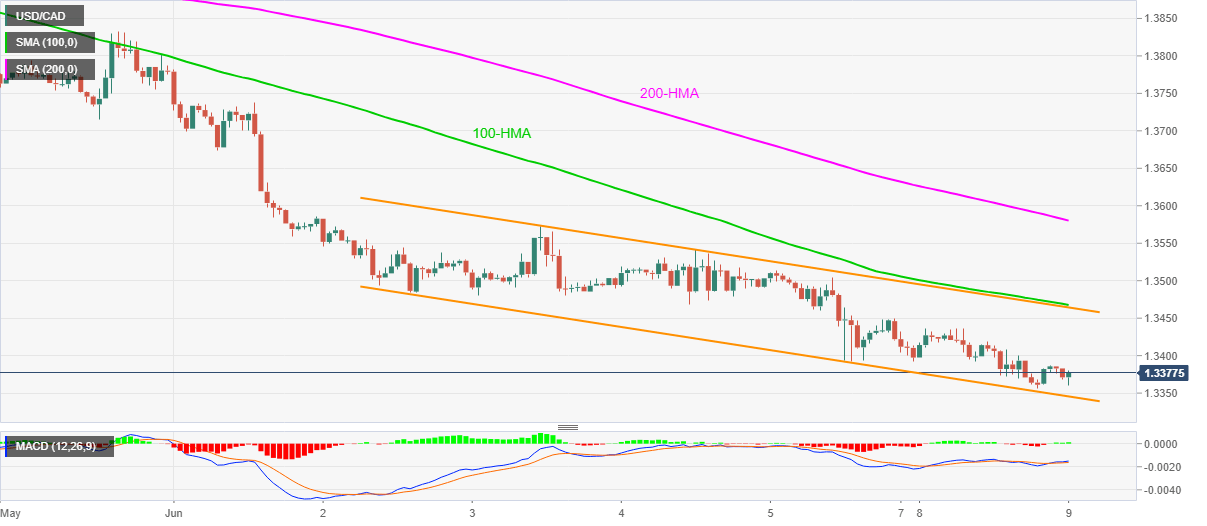
Trend: Bearish
