- USD/CAD remains pressured near the lowest since January 2020.
- Failures to cross a short-term resistance confluence favor sellers.
- 200-HMA adds to the upside barriers for the bulls’ entry.
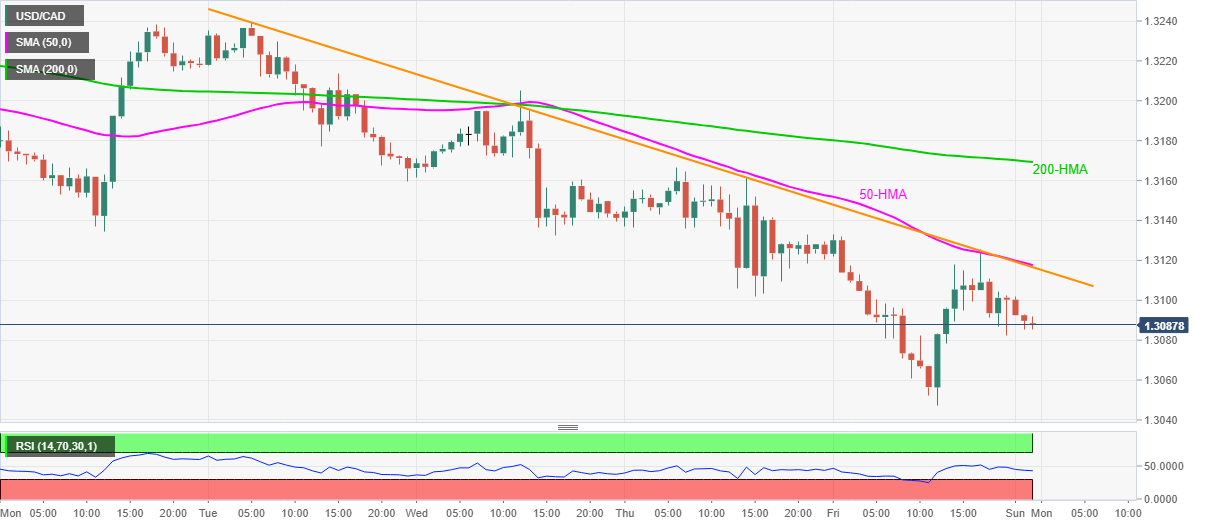
USD/CAD drops to 1.3085, down 0.10% on a day, during the pre-Tokyo open trading on Monday. In doing so, the loonie pair stays depressed for the fifth day in a row while taking rounds to the seven month low.
On Friday, the pair bounced off 1.3047, the multi-week low, but couldn’t cross a join of 50-HMA and a descending trend line from August 25.
As a result, sellers are currently targeting Friday’s low near 1.3050 before attacking the late-January bottom surrounding 1.3035/30 and the 1.3000 threshold. However, the pair’s further weakness might not refrain from attacking the yearly low surrounding 1.2950.
On the contrary, an upside break of 1.3115/20 resistance confluence will trigger the quote’s fresh rise towards a 200-HMA level of 1.3170.
Though, 1.3200 round-figures and multiple highs marked during August 20-25 can challenge the bulls beyond 200-HMA.
USD/CAD hourly chart
Trend: Bearish
