- USD/CAD bounces off a five-month-old falling support line (previous resistance).
- November, October 2019 highs are on the bull’s radar.
- 61.8% of Fibonacci retracement could return to the charts on the downside break.
USD/CAD takes the bids to 1.3295 during the early Wednesday. The pair recently took a U-turn from a multi-month-old support line that it crossed two days back.
The pair now aims for November month high of 1.3330 while its further upside could challenge October month top surrounding 1.3350.
If overbought RSI conditions fail to disappoint buyers around 1.3350, September highs near 1.3385 and 1.3400 could please return to the charts.
Meanwhile, the downside break of the resistance-turned-support trend line, at 1.3280 now, can trigger the pair’s fresh declines to 1.3220 and 61.8% Fibonacci retracement of September-December 2019 declines, near 1.3200.
During the course of the pair’s south-run past-1.3200, 50% Fibonacci retracement level of 1.3140 and a five-week-old rising support line, around 1.3120, could please the bears.
USD/CAD daily chart
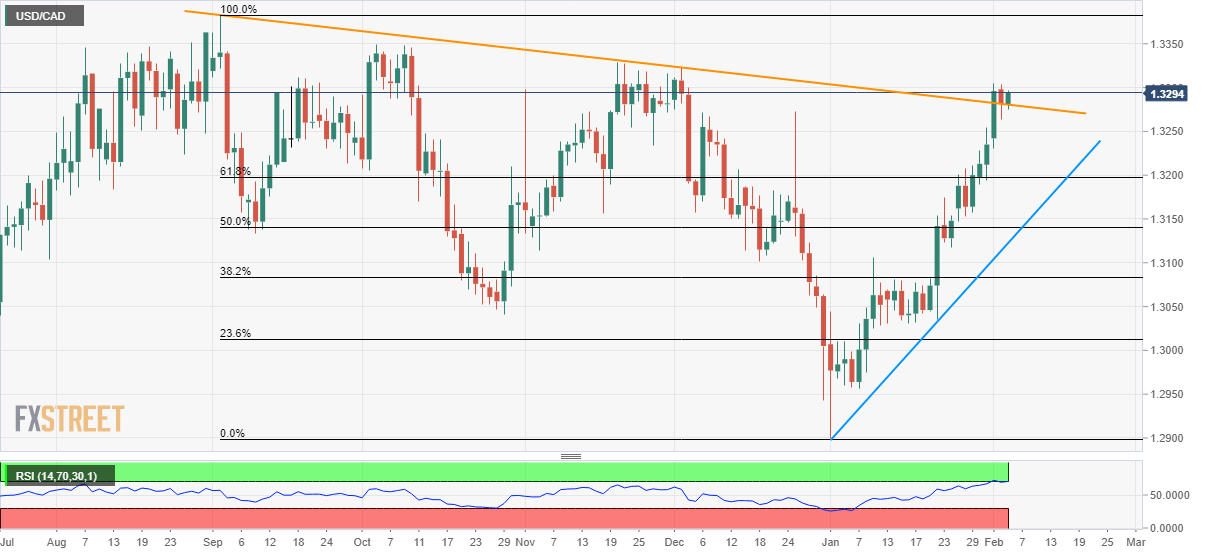
Trend: Bullish
