- USD/CAD recovers from the level last seen in April 2018.
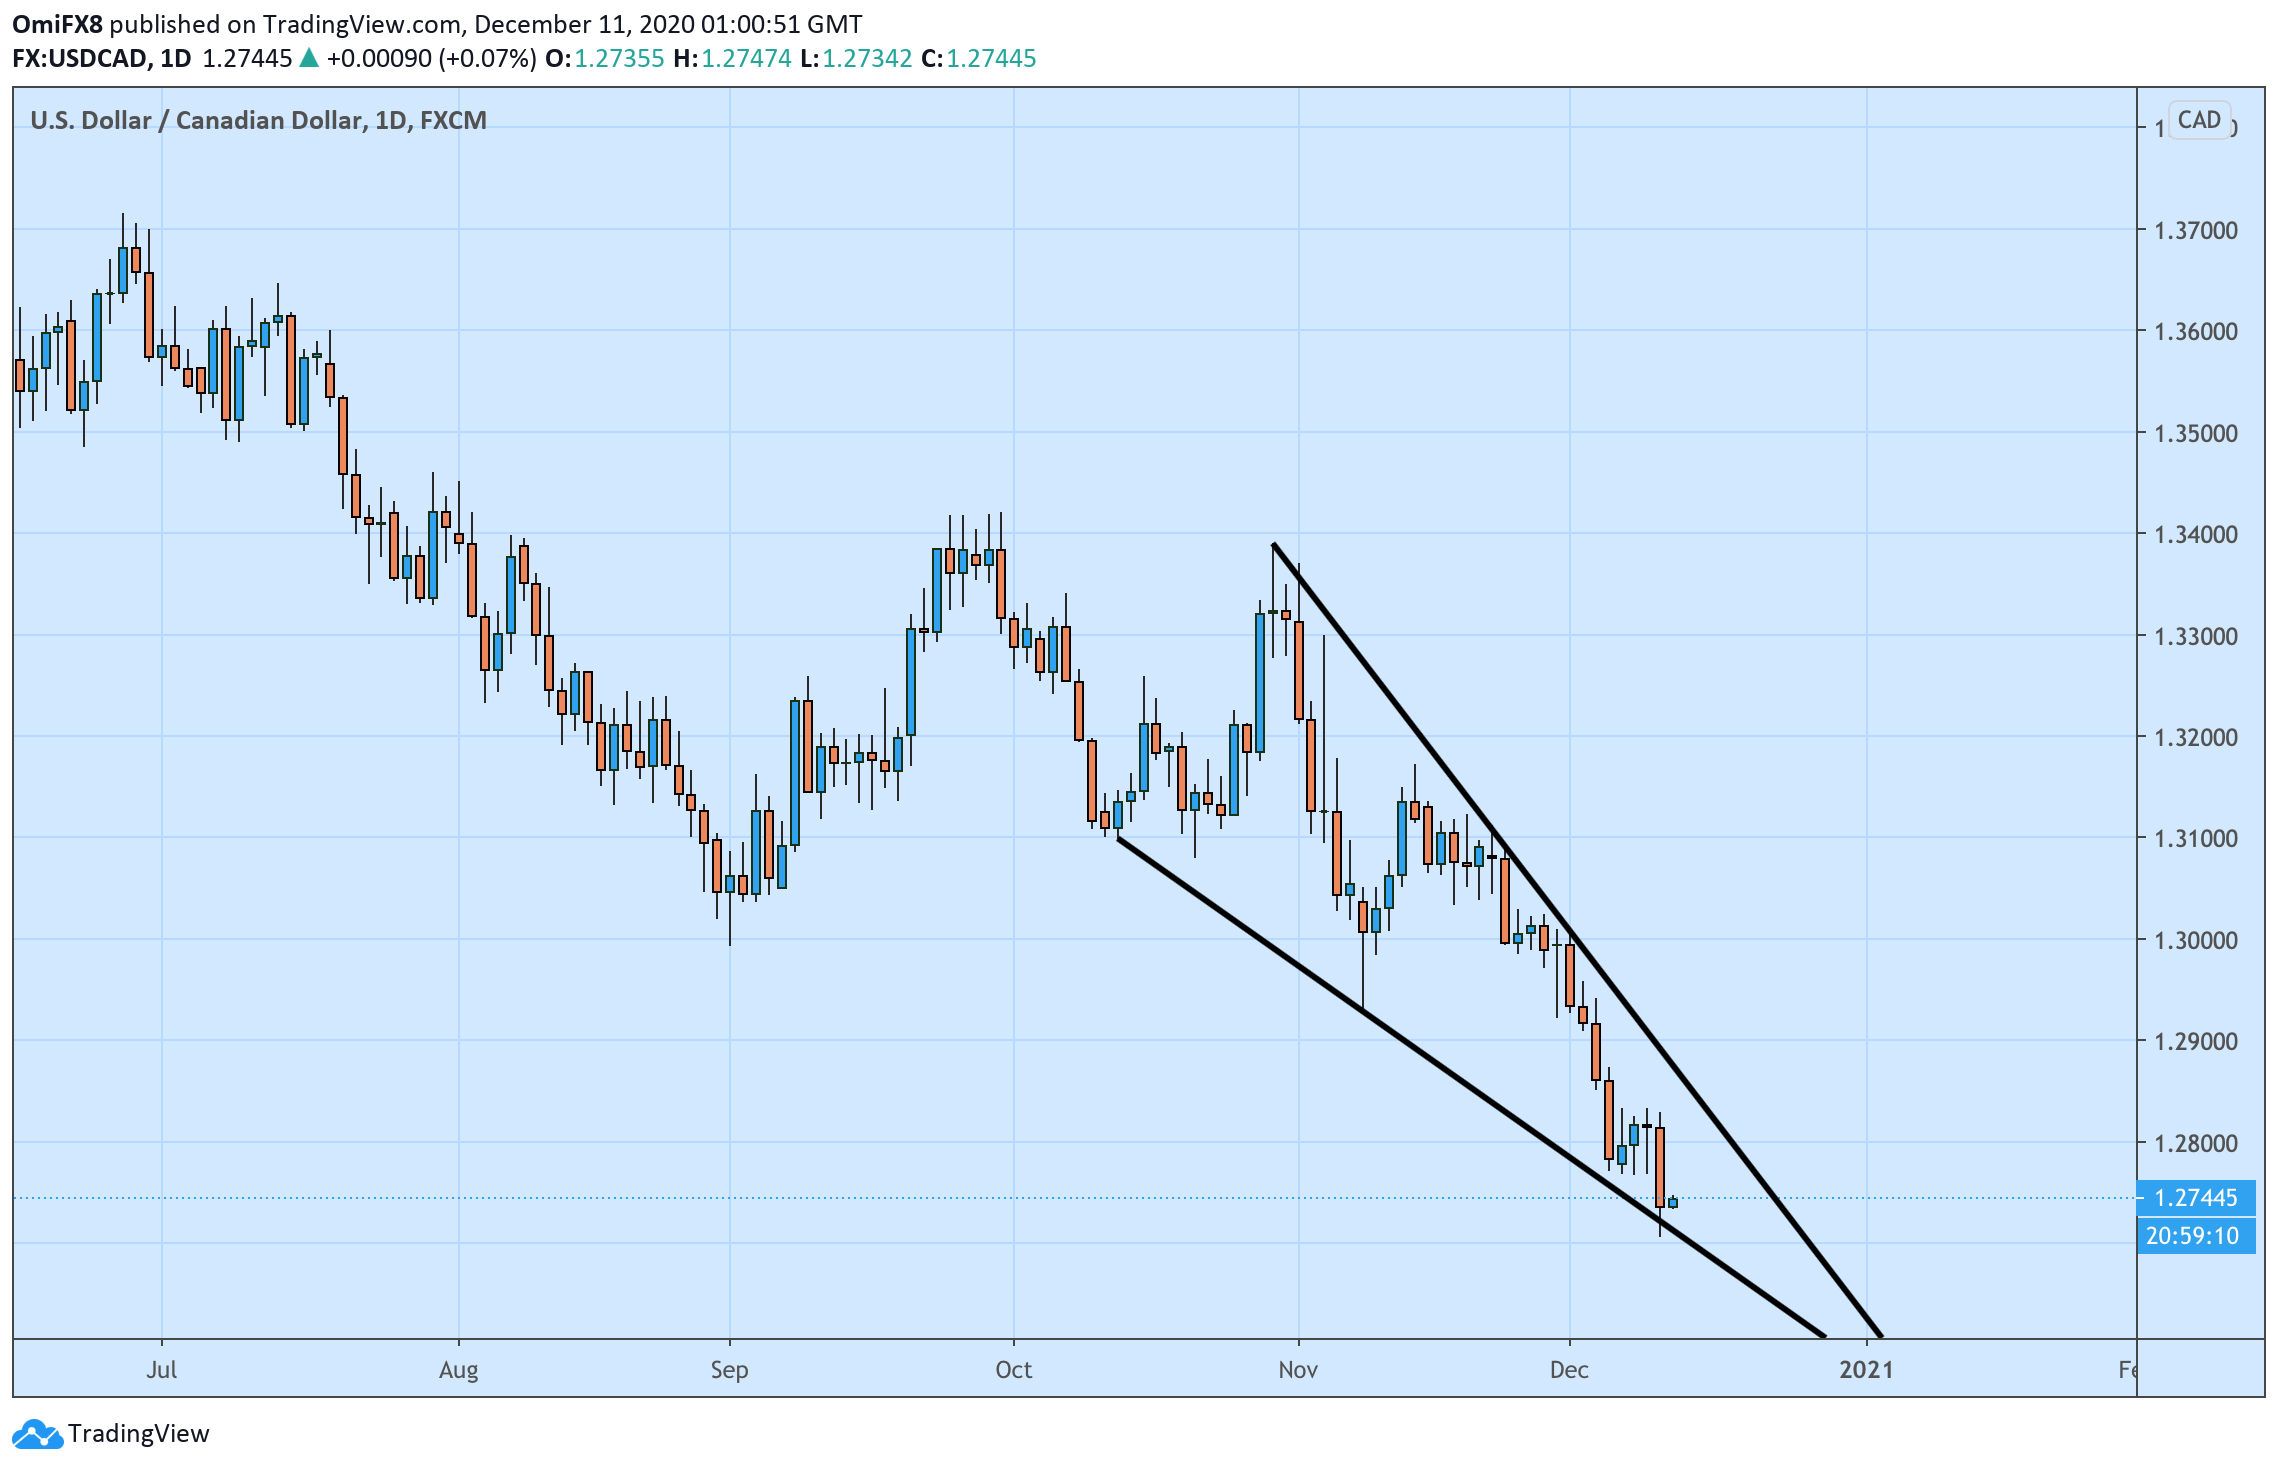
- The daily chart shows the pair has carved out a falling wedge pattern.
USD/CAD is currently trading near 1.2745, having printed a low of 1.2707 on Thursday. That level was last seen in April 2018.
The minor recovery from multi-year lows looks like an oversold bounce. The 14-day Relative Strength Index is hovering below 30, indicating the sell-off is overdone.
However, the pair is yet to exit the falling wedge represented by trendlines connecting the Oct. 29 and Nov. 4 highs and Oct. 13 and Nov. 9 lows. A falling wedge breakout would confirm a short-term bearish-to-bullish trend change. At the time of writing, the falling wedge resistance is located at 1.2876.
Daily chart
Trend: Bearish
Technical levels
