- USD/CAD steps back from 100-day EMA, still positive on a day above the weekly low of 1.3728.
- 200-day EMA offers additional support below 61.8% Fibonacci retracement.
- May 19 low, 50% Fibonacci retracement can challenge the buyers.
USD/CAD drops from the intraday high of 1.3785 to 1.3773 amid the initial hour of Tokyo trading on Friday. In doing so, the pair retreats from 100-day EMA but stays above 61.8% Fibonacci retracement level of February-March upside.
Even so, the bearish MACD and a failure to carry the bounce off 1.3728 favors the sellers.
As a result, odds of the pair’s drop to a 200-day EMA level of 1.3585 become brighter if it breaks the immediate supports surrounding 1.3765 and 1.3730.
On the contrary, an upside clearance of a 100-day EMA level of 1.3780 might not help the bulls regain the throne as May 19 low near 1.3865/70 and 50% Fibonacci retracement level of 1.3940 stand all as near-term key resistances.
USD/CAD daily chart
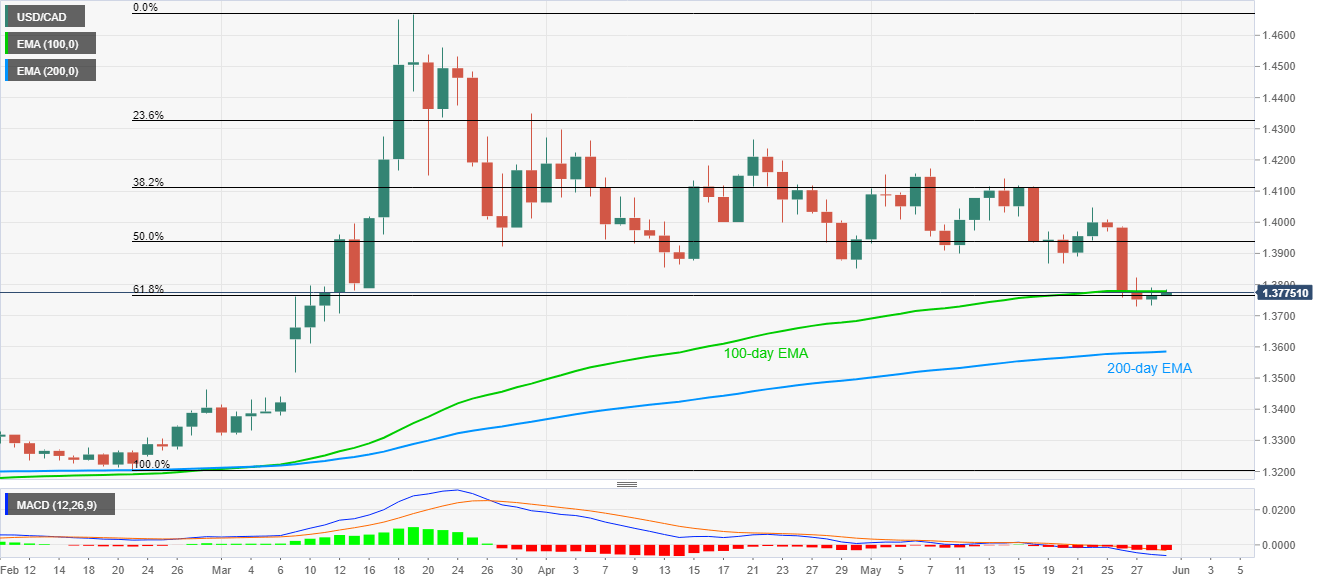
Trend: Bearish
