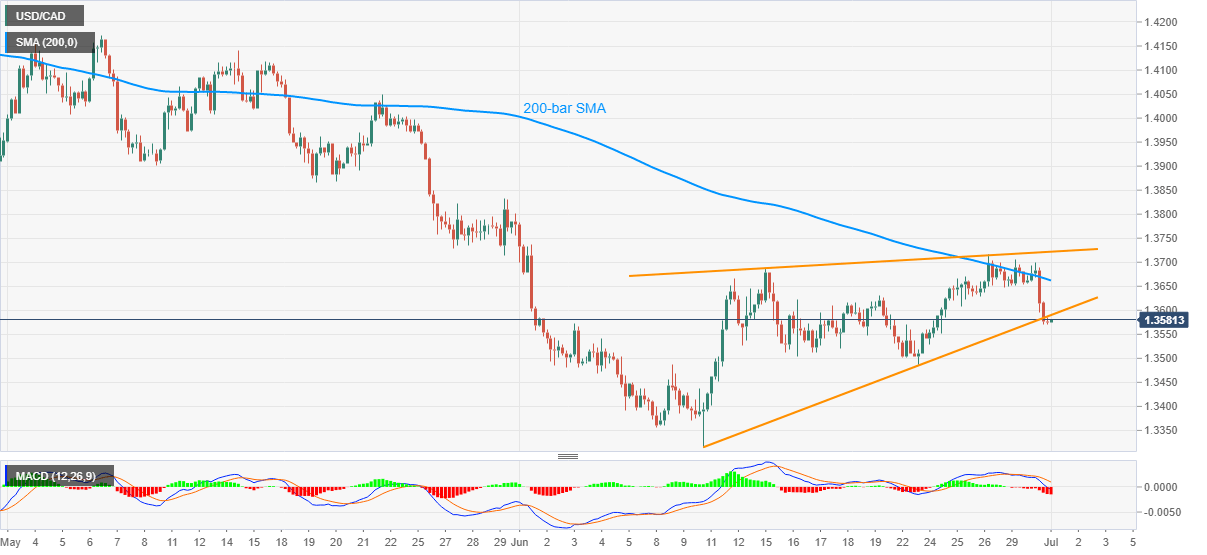
- USD/CAD trades near one-week low after confirming a bearish chart pattern.
- MACD conditions, U-turn from 200-bar SMA also favor the sellers.
- A three-week-old resistance line will follow, the formation support and key SMA to challenge the buyers.
USD/CAD takes rounds to 1.3570/80 since the start of Wednesday’s Asian session. In doing so, the quote remains around the lowest levels since June 24 after confirming a bearish chart formation called a rising wedge. Other than the chart patterns, the bearish signals by the MACD and the pair’s pullback from 200-bar SMA also suggest further downside of the USD/CAD prices.
As a result, sellers may aim for 1.3500 as immediate support during the further declines. However, 1.3490/85 area comprising June 09 top and June 23 low could offer breathing space to the pessimists.
Given the pair’s extended fall past-1.3485, the previous month’s bottom close to 1.3315 could return to the chart.
Alternatively, the quote’s bounce back beyond the 1.3590 support-turned-resistance may target 1.3650 and 200-bar SMA level of 1.3665.
However, the stated bearish formation’s upper-line around 1.3720 could question further recoveries.
USD/CAD four-hour chart
Trend: Bearish
